CCH KPI Monitoring : Query Designing

Query Designing
A KPI Monitoring event consists of two main parts:
- The triggering condition
- The response to that condition
Events may be triggered by:
- A database query
- A REST web service API (detailed in the “Web Service Integration” chapter)
- A Visual Basic (VB) script (detailed in the “Visual Basic Scripting” chapter)
Database queries can identify business conditions by using:
- A .NET Data Provider
- An ODBC data source
- An OLE/DB data source
This section covers the design and use of database queries.
A query determines whether specific conditions exist within an application’s database. An event uses one (or more) queries and if the conditions of its queries are met, the event is “triggered” and the resulting alerts, reports, and workflow actions are executed.
Most events use a single query; some events use multiple queries, especially events whose triggering is based on a combination of conditions that exist across multiple application databases.
There are three types of queries. The first is a record level query which checks for records that meet certain conditions.
For example:
- Invoices that are overdue for payment
- Stock that is approaching its re-order level
- Sales quotes that expire in 3 days
The second is an aggregate query, and it checks to see if a group of records collectively meet a certain condition. For example:
- A total of past due invoices for a single client that exceeds $10,000
- A count of more than 3 late deliveries from a supplier over the last 6 months
- An average value of open quotes that is less than $5,000
The third is a field-level change query, and it checks to see if one or more fields have had their value changed. For example:
- Customers whose credit status has changed
- A support call whose priority has changed to “Urgent”
- An inventory item whose list price has changed
One Query in Multiple Events
Consider an organization that wishes to receive the following alerts:
- Clients with overdue invoices > $2,000
- Clients with overdue invoices > $5,000
- Clients with overdue invoices > $10,000
These three alerts could each use their own query; each query checking for the corresponding dollar threshold.
However, KPI Monitoring allows one query to be used in multiple events; a query in which the triggering dollar threshold is specified on the event level.
Preparation
You'll find query design easier if you begin by identifying the event conditions that you wish to monitor.
A query serves two purposes; it identifies what conditions must be met for an event to be triggered, and it identifies which database fields may be used within the event’s alert messages and workflow.
An event uses database fields in 4 ways:
- As content for its alert messages.
- To contain an alert recipient’s delivery address (e.g., a field that contains a customer’s email address).
- As selection criteria to be passed into a Crystal or SSRS report.
- As content for an event’s workflow actions (such as data to be written into an application’s database).
Record-Level Queries
The first step in any query is to identify its purpose. For example:
“When a ‘critical’ service call is logged, send an email alert to the customer’s
account manager.”
Consider what you’d like the alert message to look like. For example:
Hello, Don Farber:
The following critical support call was just logged for client Acme Incorporated:
Contact: Tom Jones
Call Received: 09/14/2001 1:35 PM
Type of Problem: Fatal error message
Status: Open
Assigned to: Lisa MacKinnon
Description: Error 1094 during login.
You should identify the data fields you wish to put into the alert:
Hello, [salesrep_name]:
The following critical support call was just logged for [customer_company]:
Contact: [customer_name]
Call Received: [ticket_log_date] [ticket_log_time]
Type of Problem: [ticket_type]
Status: [ticket_status]
Assigned to: [ticket_rep_name]
Description: [ticket_description]
By taking these steps, you’ll know what fields the query needs to retrieve data from. And by reviewing the event’s description (“. . . when a ‘critical’ service call is logged”) we can identify the conditions that the query needs to check for:
- Calls with a priority of ‘critical’
- Calls that are received today
In terms of the recipient of an alert, in some cases, recipients are “hard-coded”; e.g., notifying your CEO or CFO. In other cases, you might wish to notify a person who is associated with the record being triggered as in the following example:
“Send an alert to the customer’s account manager when a ‘critical’ service call is logged.”
In this scenario, the alert recipient will depend on the client for whom the critical call was logged. If you look back on the alert message, you can see that the person who should receive the alert message is “[salesrep_name]”.
However, “[salesrep_name]” is not an email address; if you look further into the salesrep data, you might find a field called “[salesrep_mail_address]” – and this is the field that contains the address that you wish to send the alert to.
Note: If an event will send alerts to address(es) derived from the triggered record, the query must include the field(s) that contains those address(es).
KPI Monitoring events can also generate & deliver forms & documents (such as invoices or statements) as well as reports.
If an event will generate a report, review the report to see if it uses parameters (selection criteria). If it does, the query must retrieve the data which will get used as (passed into) the parameters. For example, an event might trigger an A/R Aging Report for an overdue client. If your report has a parameter on “client ID”, you need to make sure that your query retrieves the data from the “client ID” field, so that value can be automatically passed into the report’s parameter.
The last preparatory step is to identify whether an event will execute workflow to add or update records in an application database. If so, your query must include the data fields required for use by the workflow update procedures.
Aggregate Queries
Aggregate queries are designed much in the same way as record-level queries except that aggregate queries will use one of the following 5 options:
- Count (e.g., fewer than 5 assigned leads)
- Summarize (e.g., less than $10,000 in sales)
- Average (e.g., average response time is 47 minutes)
- Minimum (e.g., the first order placed by a client)
- Maximum (e.g., the most recent delivery)
Aggregate queries should be designed with the same considerations as record-level queries except for the fact that an aggregate query is going to be triggered by a condition related to a “group” of matching records. For example:
“If a client has more than 3 overdue invoices, send an email alert to the client’s account manager, attach an “Open Receivables” report for that client, and schedule a phone call for the account manager to contact the client.”
And – correspondingly – the alert message might look like this:
The following client has more than 3 overdue invoices:
Client: Jim Ramey
Number of Overdue Invoices: 5
Total Value of Overdue Invoices: $27,960.28
Design Basics
For every query you should identify the following:
- Purpose of query
- Alert message
- Application tables which contain the data to be retrieved
- Fields of data required by the query
- Triggering conditions
- Alert recipients
Before You Design a Query . . .
Before you start working with queries, you must have created one or more “applications” in KPI Monitoring – either by downloading and installing eventpaks, or by manually creating applications that are linked to an underlying database or other source of data.
See 'Connect KPI Monitoring to Your Application(s)' for more details on the ways you can link KPI Monitoring applications with underlying databases (such as .NET Database Provider, ODBC or OLE/DB).
Add/Edit a Query
To add a query, log into KPI Monitoring, click on the “Event Designer” option on the left and then click on “Application Events”. (You’ll see a list of applications currently configured in KPI Monitoring.)
In the “Applications” window that appears, click on the arrow to the left of the application you wish to work in. This will expand the selected application as shown in the following window:
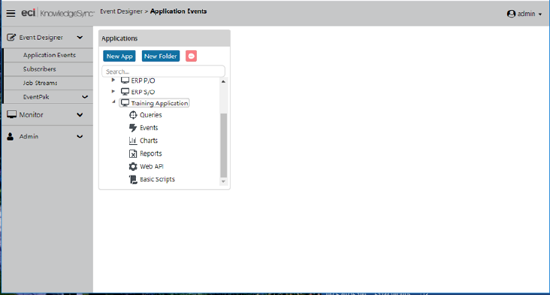
A SELECTED APPLICATION’S COMPONENTS
Click on the “Queries” branch and you’ll see a window like the following:
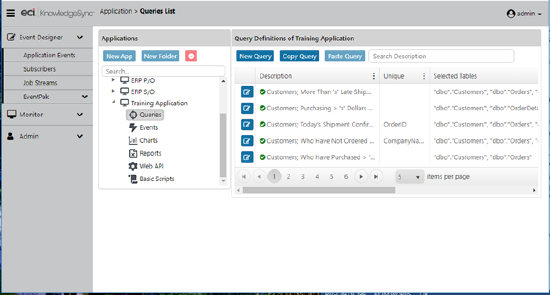
AN APPLICATION’S QUERIES
To add a query, click on “New Query” in the Query Definitions window.
You can use the “Copy” and “Paste” buttons to copy a query, and you may also use the “Search” field to locate a specific query based on the query’s name.
To view or edit a query, click on the blue “Edit” button to the left of a query’s description; to delete a query, click on the red “Minus” sign at the extreme right of the query (you may need to scroll the Query Definitions window to the right).
The following sections guide you through record-level queries as well as field-level change queries. Following these instructions is a separate section on the creation of aggregate queries. That section goes over only the differences between record-level and aggregate queries, so please review the record-level query section to become familiar with the basics of query design.
Description
The “Query Description” field contains the name of your query. Make your names short, consistent, and descriptive. We recommend starting the description with the item being monitored, followed by the condition. For example:
Jobs; Shipped Today
The “Display Description” will default to the same value as the query’s description.
Note: It’s the display description that will show in the list of queries, and that it’s the display description that will be used when you search to locate a specific query.
Click “Active” to enable a query to be used in an event.
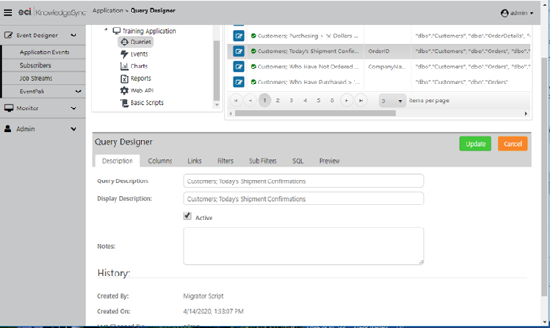
QUERY DESCRIPTION
Tables & Columns
The Columns tab is where you choose what database tables and views (and what columns within those tables/views) a query will retrieve data from. There are four things you need to consider:
What data might you wish to put into an alert message?
Even a query as simple as “jobs shipped today” would probably need to retrieve data from more than just the “job” table. The corresponding client data might be stored in an “account” table, and the client’s account manager’s details might be stored in a “salesrep” table.
Where are the alert addresses of the person(s) you wish to notify stored?
If you wish to notify a person who is “associated” with a triggered record, you need to include the table that contains their delivery address (such as their email address).
Will an event that uses the query execute any workflow actions (e.g., will it need to add or update information in an underlying database)?
Since an event can execute workflow to add or update database records, you need to consider what data the workflow needs access to.
Will an event that uses this query also execute a Crystal or SSRS report?
If an event is going to execute a report, see if the report uses “parameters” – as those parameter values will have to come from the event’s query.
To select columns for a query, you first need to select the table(s) that contain those columns. Go to the list of Available Tables and click on green “Plus” sign to the left of each desired table. (You may also double-click on the desired table name.)
If you accidentally select the wrong table for a query and wish to remove it, go to the list of Selected Tables and click on the red “Minus” sign next to the table you wish to remove.
Choosing the Same Table Multiple Times (Table Alias)
Consider the following scenario: You want an alert about invoices that are overdue. Each invoice is associated with a customer and a salesrep. A table called “email” stores the email addresses of both the client and of the salesrep.
In order to get both email addresses, KPI Monitoring needs to access the “email” table twice – once for the customer’s address, and once for the salesrep’s address. But – in SQL -- you cannot choose the same table twice in a query, so KPI Monitoring lets you create a “table alias” for just such occasions.
When you select the same table multiple times, you are given the ability to specify an alias name for that table.
Columns
After you have selected the tables for a query, the next step is to select the columns (data fields) that you might wish to use in your event. Consider the following when selecting columns:
- What data do you want to put into your alert messages?
- Is the address of a person you wish to notify contained within a database field?
- Will your event need to pass data into a report’s selection criteria?
- Will your event need to use data in an application update (workflow)?
- Will your event need to “sort” matching records by certain fields?
How to View & Select a Table’s Columns
Under “Selected Tables”, click on the blue right-arrow to the right of the table whose columns you wish to display (or double-click on the desired table). The columns of the selected table will appear.
To add a column to a query, go to the list titled “Columns of Selected Table” and either click on the green “Plus” sign to the left of the column name or double-click on the desired column.
In addition to the column’s name, you are also shown the type of data stored in the column (e.g., text, date, numeric, etc.) and the length of that column.
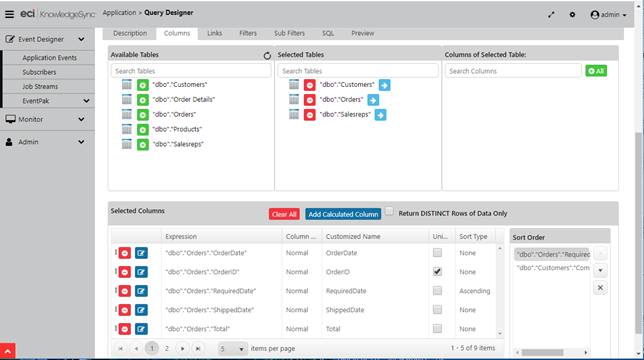
As you select columns for a query, you may need to move to ensuing pages to see all your selected columns – which will look like the following:
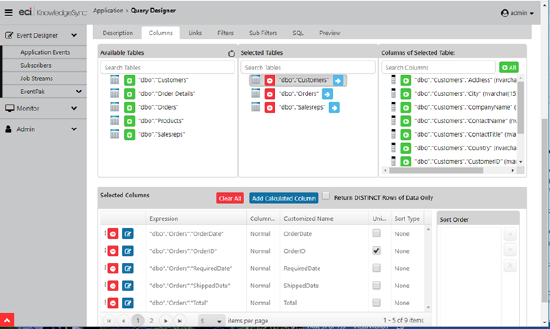
COLUMNS SELECTED FOR A QUERY
Selecting “All” Columns
To include all columns for a selected table, click on the green +All button.
Although this is an excellent way to see all data from a specific table, this is not suggested for normal query building as it makes it more difficult to see (and select) only those columns needed for an event.
Editing/Removing a Selected Column
To edit a column (to include calculations, change its format, etc.), go to your list of Selected Columns and click on the blue “Edit” button to the left of the selected column’s name.
You will be taken into a special editing window, complete with advanced calculation functions to choose from.
To remove a selected column from a query, click on the red “Minus” sign to the left of the selected column’s name.
Column “Type”
Record-level and field-level change queries always use a column type of “Normal”. The other column types are detailed under the “Aggregate Queries” section of this chapter.
“Customized Name”
When an event’s alert message is designed, you refer to the query’s columns by using the columns’ “Customized Names.” This is important, as some applications have cryptic names for their columns. For example, an “activity” table may have a column called “ddate” – designed to store an activity’s “due date”.
Using a column’s “Customized Name”, you can create your own “label” for a field, for example “due_date” for the scenario above.
When you select a column for a query, KPI Monitoring will take the column’s name and place it in the “Customized Name” field. You can then modify that value.
Here are some notes about using customized names:
- Do not include blank spaces. (use “due_date” and not “due date”).
- Keep customized names under 25 characters.
- Do not begin a customized name with SQL reserved words, such as “sum”, “sub”, “add”, “avg”, “min”, “max”, “total”, “trim”, and “format”.
- Do not have multiple fields with the same customized names; you won’t be able to tell them apart.
- Use only letters and numbers in a customized name; do not use symbols.
- Do not change the default Customized Name of a query’s “unique” column if the query tracks changes to the value of one or more database fields.
A Query’s “Unique” Column
In KPI Monitoring, you can specify whether an event will trigger just once for a record that meets its criteria, or will trigger repeatedly, each time the event runs, for as long as a record continues to meet the event’s criteria. For example:
- Trigger Once: At 9 AM, activity #123 is overdue and triggers an alert. At 10 AM the activity is still overdue, but since it already triggered, it does not trigger another alert.
- Trigger Repeatedly: At 9 AM, activity #123 is overdue and triggers an alert. At 10 AM – and every hour thereafter, it triggers and alerts again (until the activity is no longer overdue).
Although the option for one-time versus repeat triggering is specified on the event level, you need to do something on the query level to enable this option.
To enable records to trigger only once, KPI Monitoring has to “remember” a triggered record. This is done by identifying which column uniquely identifies a triggered record. (This is often referred to as a record’s “key”; in KPI Monitoring this is referred to as a query’s “unique” column.)
If you do not specify a query’s unique column, any event that uses this query will automatically be in “repeat” mode.
If you do specify a query’s unique column, you will have the option (on the event level) to specify one-time or repeat notifications.
To specify a query’s unique column, go to your list of selected columns for a query and put a checkmark in the “Unique” box of the one column that uniquely identifies each record (such as a “client ID” or an “order number”).
Notes:
- Always specify a unique field for non-aggregate queries.
- Only one column may be checked as unique. If a unique is based on the combined values of two or more fields (e.g., “order number” and “line number”), create a multi-field unique (see “Multi-Field Unique”).
- Do not change the default Customized Name of a query’s unique column if the query tracks changes to the value of one or more database fields.
- The maximum length of a unique column for a query is 64 characters.
How a Record Becomes “Un-Triggered”
Consider an event that runs daily and is set to “not repeat” its alerts about customers who get placed on credit hold.
On Monday, Acme Corp is placed on credit hold and an alert is sent.
On Tuesday, Acme Corp is still on hold. The event (set to “not repeat”) runs but does not trigger another alert about Acme.
On Wednesday, Acme is taken off of hold. The event runs, sees that Acme no longer meets the event’s criteria, and “clears” (“un-triggers”) the Acme record.
On Thursday, Acme is once again placed on credit hold. The event runs, is newly triggered, and another alert is sent.
Multi-Field Unique
To create a multi-field unique, you’ll need to concatenate (combine) the values from the two (or more) fields.
The “type” of fields you concatenate must be “character” or “string” type fields. To concatenate fields of other types (e.g., numeric or date), you must convert the fields into character format first. (See “Field Editing Notes”.)
To concatenate fields (for SQL Server), follow these steps:
- Click on the button called “Add Calculated Column”.
- Choose the first database column that you wish to comprise your concatenated unique.
- Click in the Calculated Column Workbox and enter a plus sign (+) after the column name you have selected.
- Choose the second database column that you wish to comprise your concatenated unique. The concatenated column is now complete and looks like the following:
sysdba.orders.order_number+sysbda.orders.order_lineno
(The concatenation symbol for an Oracle database is two vertical bars (||).)
You cannot use a concatenated unique if your query is checking for a “change” to the value of a field in a database. (Instead, create a “view” to the desired table and concatenate the unique columns within the view.)
Order Line Item Unique
In many ERP systems, an order’s details consists of a “header” and “line item details”. Because of this, every order detail line has the same order number associated with it.
In such cases, make sure that the query’s unique consists of both the order number AND the line number. That way, each detail line has its own unique value.
Note: You can concatenate only text-based fields; thus if you needed to concatenate the “order.number” and “order.lineno” column but both are numeric in format, your concatenation syntax (under SQLServer) would appear as follows:
convert(char(10),order.number)+convert(char(10),order.lineno)
Calculated Fields
Examples of calculated fields are:
- The number of days until an invoice is due
- Unit sales price times quantity ordered
- Percentage of credit limit remaining
Calculated fields may be used in a query as well as in an event’s alert messages, report selection criteria and workflow actions.
To create a calculated field, click on the “Add Calculated Column” button. To add a calculation to a selected column, just click on the blue Edit button that appears to the left of that column.
The Calculated Column Editor provides you with a list of frequently-used arithmetic calculations at the top of the window; you may use any valid arithmetic symbols and functions (such as ‘+’, ‘-‘, ‘/’, and ‘*’) as well as any valid SQL functions that are approved for use with the database and data provider you are using.
The editor also provides you with a list of all columns from your selected tables, as well as KPI Monitoring’s complete list of date substitution variables. The “workbox” at the bottom of this window is where your calculation syntax is formatted.
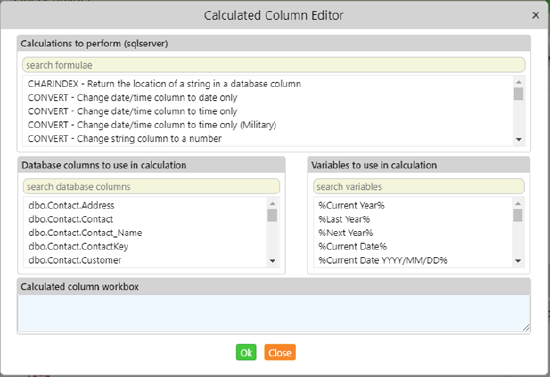
CALCULATED COLUMN EDITOR
If you select any of the functions from the list of calculations, KPI Monitoring will automatically format that function for you, and all you need to do is select any remaining elements for that function.
Example #1: a calculated field that computes the gross margin percent of an item.
The gross margin is calculated by determining the difference between an item’s price and cost, multiplying that amount by one hundred, and then dividing that amount by the item’s cost. You would do the following in the Calculated Column editor:
Double-click on the column that contains an item’s price; you’ll see something like:
INVENTORY.ITEMPRICE
In the workbox area, add a minus sign after that field
INVENTORY.ITEMPRICE-
Double-click on the column that contains the item’s cost.
INVENTORY.ITEMPRICE--INVENTORY.ITEMCOST
Type in parentheses around this expression.
(INVENTORY.ITEMPRICE--INVENTORY.ITEMCOST)
Type in *100 at the end of your calculation.
(INVENTORY.ITEMPRICE--INVENTORY.ITEMCOST)*100
Type in an additional set of parentheses around the entire expression.
((INVENTORY.ITEMPRICE--INVENTORY.ITEMCOST)*100)
Type in the division symbol “/” at the end of your calculation
((INVENTORY.ITEMPRICE--INVENTORY.ITEMCOST)*100)/
Double-click on the item’s “price” field again.
((INVENTORY.ITEMPRICE--INVENTORY.ITEMCOST)*100)/ INVENTORY.ITEMCOST
Click on “OK”.
Example #2: A field that determines the number of days until an invoice is due.
In Microsoft SQL Server, this calculation uses of a function called “DATEDIFF”, which calculates the number of days between two dates. Thus, you would click on the “Add Calculated Column to Query” button and choose the function “DATEDIFF – Difference in Days between two dates”. The following will appear in the workbox area:
DATEDIFF(DAY,$Column$,$Column$)
Since you want to calculate the number of days between “today” and an invoice’s due date, select the “%Current Date%” variable and follow that by selecting the column that contains an invoice’s due date. Your result will look like this:
DATEDIFF(DAY,'{%Current Date%}',dbo.tarInvoice.DueDate)
Calculated Field Notes
Use a query’s “Preview” to ensure that your calculation syntax is correct.
Be sure to modify the “Customized Name” of a calculated field.
A single query can have multiple calculated fields within it.
Copy and paste the contents of a calculated field by using CTRL/C to copy the contents and CTRL/V to paste them.
Verify the format in which an application stores its “date” or “date/time” values. Even though the values might be displayed in one format (e.g., mm/dd/yyyy), your app might store them in a different format (e.g., yyyymmdd).
Date-Related Functions
Most databases (and drivers) allow you to calculate the difference between two dates. The syntax of these functions is dependent on the database (and provider) you are using.
Here are a few examples:
Invoices Due Within ‘x’ Days (MS SQLServer)
datediff(Day,'{%Current Date%}’,ARinvoice.DueDate)
Client Whose Last Order Was More Than ‘x’ Days Ago (MS Access)
datediff('d',"Invoice"."DateCreated",'{%Current Date%}’)
Quotes Due to Expire Within ‘x’ Days (Pervasive SQL)
datediff(Day,oehdr.CancelDate,’{%Current Date%}’)
The number of hours between a date/time field and the current date/time
datediff(hour,table.column,'{%Current Date%}’
Add 3 hours to the current date/time
dateadd(hour,3,'{%Current Date%}’)
Add 3 hours to the value in a database field:
dateadd(hour,3,table.column)
Configuring a Query to Deliver to Multiple Dynamic Addresses
A common requirement in query design is when you wish an event to send alerts to multiple addresses that are drawn from database values. For example, an event monitoring open support tickets might need to notify both the rep whom the ticket is assigned to, and the salesperson who is assigned to that client’s account.
Although an event supports multiple dynamic delivery addresses (such as the “send to”, “cc”, and “bcc” email addresses), only a single query field may be referenced for any one of those options (i.e., you can specify only one query column for the “send to” addresses).
In order specify multiple addresses for one of these options, you need to combine those addresses into a single field such as:
sysdba.ACCOUNT.EMAIL+','+sysdba.USERINFO.EMAIL
(Multiple email addresses are separated with commas.)
Trimming “Padded Spaces” from a Value
Sometimes column values contain “leading” or “trailing” spaces and you may not want KPI Monitoring to include these spaces when it retrieves the column’s value.
Depending on the database being monitored, you can use the following functions. (The following are for SQLServer databases.)
- rtrim: Remove all following spaces from the right side of the field value
- ltrim: Remove all leading spaces from the left side of the field value
- trim: Remove all surrounding spaces from both sides of the field value
The format for using these functions is:
trim(table.column) (SQLServer)
Retrieving ‘x’ Characters of a Value
Sometimes you might not want to retrieve the entire contents of a field; you may (for example) wish to retrieve only the day of a person’s birthday (as opposed to the day, month, and year).
To do this, you would use the “substring” function as follows:
Substring(table.column,starting position,length)
For example:
Substring(account.name,1,20) (SQL Server)
This would retrieve the first 20 characters of an account’s name.
Converting a Field’s Data Type
If you need to convert a field from one data type (such as numeric) into another type (such as character) you would use the “convert” function as shown in the following example:
Convert(char(20),account.createdate,0) (SQLServer)
This converts a date field into a string field.
For an Oracle database, the command is:
TO_CHAR(TABLE.NUMBER,'9999999')
This turns a numeric field into a string.
For a Pervasive SQL database, the command is:
convert(ARTRAN.OrderNumber,sql_char)
This turns a numeric field into a string.
Retrieving the “Top x” Number of Records
Another useful function is the ability to retrieve only the top ‘x’ number of records that meet your criteria. (For example, the top five sales this week.) The syntax for doing so (under SQLServer) is:
Top x table.column
As in:
Top 10 sales.amount (SQLServer)
Creating a Column that is a Label + Field Value
In some cases, you may wish to create a column that contains both a field “label” as well as the field’s value. This is useful if you have a field whose label you do not wish to appear in an alert message if the value of the field itself is blank (or null).
For example, let’s say that you have an ERP system in which you have four types of line items: inventory, non-inventory, miscellaneous charges, and comment lines. Only inventory items contain a warehouse code, and for those lines you wish to include a section in your alert message that says
WHSE: Boston
(where “Boston” is the name of the warehouse from your ERP database)
Since the three other line types do not use a warehouse, you do not want the label “WHSE:” to appear in the alert message for those lines.
The answer is to combine the label (‘WHSE:’) with the value from the warehouse field. Thus your query column would look like the following:
'WHSE:'+' '+InvDetail.Whse
And – as you’ll learn in the “Event Designing” chapter, you can tell KPI Monitoring not to include (or allocate space to) any field whose value is null.
You can add labels to only character-based fields.
Note: The preceding logic will work only if the lack of a value in the warehouse field is represented as a “null” value; this is because when you add a constant value (such as “WHSE:”) to a column with a null value, the ending result is still a null value. (I.e., any value + a null value = a null value)
Creating a Column that Contains a Dynamic Date Value
KPI Monitoring includes many date substitution values, such as “current date”, “last Monday date”, “next Friday date”, and so on. To use one of these fields as a column within a query, surround the variable with single quote symbols as in the following:
'{%Last Friday Date%}'
Retrieving Only the Month or Day from a Date Field
To retrieve just the month or day from a date field, use the following syntax:
month(hrpersnl.p_birth) (SQLServer)
day(hrpersnl.p_birth) (SQLServer)
Creating a Column that Contains a Hard-Coded Value
To create a column that contains a hard-coded value such as an email address (e.g., smith@KPI Monitoring.com), follow these steps:
- Add any column to a query.
- Edit the column you just added and delete the existing column name.
- Type in a single quote (‘), followed by the hard-coded value, followed by another single quote (as in ‘smith@KPI Monitoring.com’).
- Go to the “Customized Name” for this column and enter an appropriate name for this field.
Creating a Column Pointing to a File Spec
One of KPI Monitoring’s special functions is to create a column whose contents are a file spec – that is, the column refers to the name and location of one or more files that you wish KPI Monitoring to deliver. Multiple files (referenced within the column’s value) must be separated by commas.
The file spec referred to within this column must use either the actual server, disk and directory spec, or must use UNC format; do not refer to mapped drives.
When you add such a column to a query, the Customized Name of that column must be “attachment_files” (case sensitive).
When an event uses a query that contains such a column, you’ll have the option to instruct KPI Monitoring to deliver the corresponding file(s) via email, webcast, or Copy/FTP.
In a web service call or VB script, if a response parameter was named “attachment_files”, KPI Monitoring will use that as the name of the file to be attached.
Creating a Column Pointing to a Dynamically-Named File Spec
You can modify the use of the above “attachment_files” option to specify a dynamically-named file by referring to a column name (e.g., “{order_no}”) within the associated file’s name.
For example, you might have multiple files that store customer order tracking details in your ‘C’ drive. These files are named according to the order they relate to as in:
- Tracking_100.pdf
- Tracking_101.pdf
- Tracking_102.pdf
(and so on)
(The above 3 files contain tracking details for orders #100, #101, and #102.)
As long as your query retrieves the “order number” value (e.g., in a column named “orders.order_number”), you can have KPI Monitoring to pick up the files associated only with the order records that meet your query’s criteria. In this case, you would modify the name of the selected column to read:
'C:\Tracking_{order_number}.pdf'
You refer to the customized name of the desired column, within curly braces. KPI Monitoring will automatically substitute in the appropriate order numbers and retrieve the corresponding PDF files.
Make sure that the customized name for the column that retrieves these files is “attachment_files” (do not include the quotation marks) and be sure that the options to “include files”, include “reports”, and “reports must wait” are ALL checked ‘on’ in any events that use this query.
“If – then – else” Logic
Consider the following logic:
- “if the contact’s email address is blank, use the default account email address”
- “if the contact’s email address is blank, use the salesrep’s email address”
- “if the value of the credit status field is “H”, I want the alert message to read “Hold”
To check the value of a field and then modify that value (or use a different value) is very useful. The SQL syntax for doing so is:
CASE table.column when 'value' then table.column+'value' else table.column END
If, for example, you have a column in a table that has values of I, C or D and you want to display them as IN, CM, and DM in your alert message, you’d create three columns in your query as follows:
- CASE table.column when 'I' then table.column+'N' else table.column END
- CASE table.column when 'C' then table.column+'M' else table.column END
- CASE table.column when 'D' then table.column+'M' else table.column END
The preceding syntax is for SQL Server databases.
Removing Columns from a Query
To remove a column from a query, go to the “Selected Columns” window, click on the red Minus sign to the left of the field you wish to remove.
Return Distinct Rows of Data Only
What if you wished to receive a list of all customers who placed orders last month – but didn’t wish to see any duplicate records (such as if a client purchased multiple times during the month)? This is referred to as “returning distinct records only” (eliminating any duplicate records) and is available via a checkbox in the “Selected Columns” window.
“Return distinct” is based on the columns chosen for a query, so (using the previous example of client orders), if you choose just the client’s name, your results will show one record per client. If, however, you choose (as columns) both the client name and their order number, a client who purchased multiple times during a month would appear (in the query’s result set) multiple times, as each order number is “distinct”.
Sub-Queries (Embedded Selects)
One of the more advanced query design functions is the ability to create a column whose value is the result of another query. This is referred to as “sub-queries” or “embedded selects”.
Embedded selects require advanced SQL syntax knowledge, as each column name would be edited to include a SQL select statement.
Embedded selects must use the same database provider as the query in which they are embedded.
To create, view, or modify embedded selects, use the Calculated Column Editor, as it gives you a full-screen editor in which to create your embedded select statement.
KPI Monitoring has an EventPak that illustrates the use of embedded selects. To receive this Pak, please contact Customer Support using the form on our website.
Sort Type (Record Sorting Order)
When a query runs, it retrieves matching data records. You can specify the order in which these records will be listed and processed. (And this is the order in which those records will be shown in any corresponding alert messages.) This is the query’s “sort type.”
Any fields that were selected for the query’s “Columns” are available for use in its sorting order. To select your sorting order, go to the “Selected Columns” window, locate your first field for sorting purposes (you can have multiple levels of sorting), click in the “Sort Type” (it will default to “None”), and select either “Ascending” or “Descending”.
The selected column will now appear in the “Sort Order” window.
Note: If you choose multiple columns for sorting, you can re-order those selected columns using the up and down arrows in the “Sort Order” window. (And you can use the ‘x’ button to remove columns previously selected for sorting.)
The “Sort Order” window will appear like the following:
QUERY “SORTING” (BOTTOM-RIGHT)
The Effect of Sorting on “Grouped” Alert Messages
“Sorting” controls the order in which matching records are displayed in alert messages. This is especially important when you want an event to “group” records together – such as sending each employee an alert that lists all of their overdue activities or sending a customer an alert listing just their orders.
In order to send alerts where similar records are grouped together (i.e., all of an employee’s activities, all of a customer’s orders) you must use Sorting to group those records accordingly within the query’s result set.
(In the above examples, if you do not sort the records, an employee or salesrep might receive multiple alerts, each alert containing one, or just a few of their records, instead of a single alert containing all of their records.)
In the preceding examples, the “overdue activities” query would sort by rep, the “customer order listing” query would sort by customer number (or name).
Links
If you have chosen more than one table, you must tell KPI Monitoring how those tables are linked (or “joined”) together. It is essential that you choose the query’s primary table first in your series of links.
In the example of a “Jobs; Created Today” query that uses the “jobs” and “organizations” tables, this query’s primary database table is the “jobs” table.
Link your tables by doing the following:
Click on the “Links” tab. You will see the following:
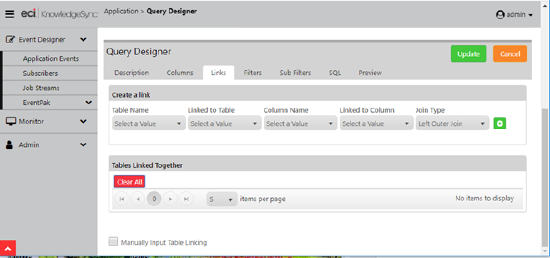
QUERY “LINKS”
To add a new link:
o Under “Table Name,” select the query’s primary database table.
o Under “Linked to Table Name,” select (or confirm) a corresponding table.
o Under “Column Name,” select the “link from” field.
o Select the “link to” column name. If a column in the “Link to Table” is found with the same name as the “Link from Table,” that column will be loaded into the “Linked to Column Name”.
o The link type will default to “left outer join”; leave this unless your database schema specifically requires a different type of join.
o Click on the green Plus sign to add the link.
Once one or more links are added to a query, this tab will look like the following:
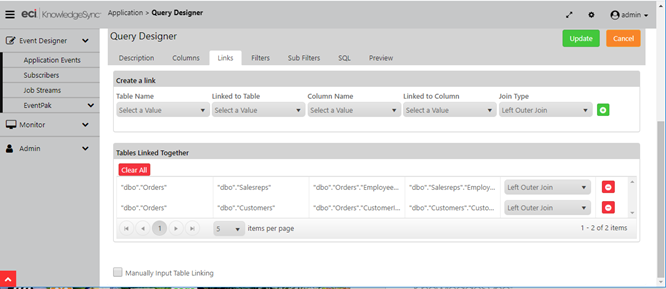
SUCCESSFULLY ADDED LINKS
If you have more than two tables that require linking, repeat the above process until all tables are linked. In most cases you will have a number of links that is equal to one fewer than the number of tables the query is using.
Manually Input Table Linking
Depending on the applications, databases, and connection method (.NET Provider, OLE/DB, ODBC) you are using, you may come across an instance where KPI Monitoring’s default linking syntax is not sufficient for the type of “join” you wish to create.
To specify your own table linking syntax, follow these steps:
- Join the two tables together using the table linking wizard.
- Click on the SQL tab and copy the “join” syntax (starting after the word “from” and ending before the ‘)’ symbol. Do not include the parentheses that begin and end the join syntax. E.g.,
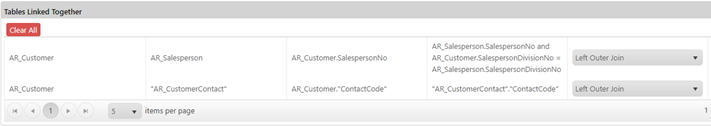
dbo.Jobs LEFT OUTER JOIN dbo.Organizations ON dbo.Jobs.jmpCustomerOrganizationID = dbo.Organizations.cmoOrganizationID - Click back on the Links tab, click on the checkbox titled “I would like to manually input the table linking.” A blank line will appear.
- Paste the “join” syntax that you copied from the SQL tab into this line.
- Edit this syntax to perform the join as you require.
You may also directly edit the field names in the “Tables Linked Together” grid, detailed in the following section.
Note: If you manually edit the linking syntax for a query, that query is no longer eligible for KPI Monitoring Support Services. (Thus it is highly recommended that you use the technique detailed in the following section for modifying a query’s links, as this method will keep the query eligible for technical support services.)
Modifying Your Links
Do not select “I would like to manually input the table linking”.
Under “Tables Linked Together”, locate the link you wish to modify.
Click your cursor in any of the “column name”, “linked to column”, or “join type” fields.
Manually type in (or select) the desired syntax. Any valid SQL syntax is supported.
Multi-Column Links
To link one table to another using more than one column, follow these steps.
- Create a link using the first of the two fields you need to link with.
- Click in the "Linked to Column" field; an edit-capable window appears.
- Add a blank space after the column name.
- Type in "and table1.2nd_link_column = table2.2nd_link_column"
- In place of "table1.2nd_link_column", key in the secondary linking column in the first table, and in place of "table2.2nd_link_column", key in the secondary linking column in the second table. Do not include the quotation marks in your syntax.
A MULTI-COLUMN LINK
Filters
The most important part of query design is the “conditions” that will cause the query to trigger an event. These conditions are referred to as “filters” and “sub-filters”.
There are four general concepts of filter design. They are:
- What column values do you need to test
- What “operator” will a filter use
- What will the column value be compared against
- Should a filter be parameter driven
The following sections address each of these concepts.
Available Column Values
Filters can check the value of any column within any tables or views within a database. They can identify new records, records that meet specific criteria or thresholds, and can also check to see if the value of a field has changed.
Operators
A filter can use the following operators (along with “is” or “is not”):
- Equal to (priority is equal to “high”)
- Between (use “greater than or equal to” and “less than or equal to” instead)
- Greater than (amount is greater than 100)
- Greater than or equal to
- Less than (amount is less than 100)
- Less than or equal to
- Like (contains the string of letters “brit”)
- Null
- One of (priority is one of “Critical”, “High”, or “Medium”)
- Starting with (starts with the letter “brit”)
A filter can also use one other operator:
Value has changed since the last time KPI Monitoring checked it
Compare Values
A filter can do much more than compare the value in one field against a constant value (e.g., test for a priority of ‘high’). Here are some examples of other tests that can be executed by a filter:
- Test a field against another field (sale price is less than the cost of goods)
- Test a calculated field against a constant value (Sales amount * sales probability is greater than 10,000)
- Test one calculated field against another calculated field (percentage of damaged items > percentage of undamaged items)
- Test a numeric field against a range (sales probability is greater than 60% and less than 90%)
- Test a date field against a date variable (forecast close date is equal to “today”)
- Test a calculated date value against a threshold (due date is within 7 days)
- Test a calculated date field against a variable (expire date is this month)
Parameter-Driven Filters
Consider this scenario:
Your sales manager wishes to be alerted about pending sales greater than $25k. Your CFO wants to know about sales greater than $50k. And your CEO wants to know about sales greater than $100k.
Do you need three different queries? The answer is no.
You can design one query called Sales > ‘x’ Dollars.
This is a “parameter-driven” filter. Three different events can each use this same query but specify a different triggering threshold (sales amount) on the event level.
Filter Components
When you click on the “Filters” tab you will see the following:
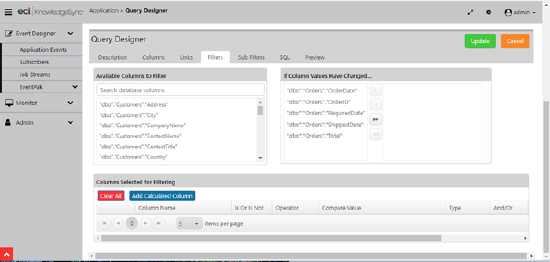
QUERY “FILTERS”
When creating a filter, you can select a specific column (from the list of “available columns to filter”) whose value you wish to test, and/or you can select one or more columns (from the list of “if column values have changed”) should you wish to monitor a column for a change to its value. (See “Value Change Filters”).
To select an available column to filter, double-click on the desired column. To create a filter based on a calculated column, click on the “Add Calculated Column” button. To edit a selected column (such as to add a calculation to it), click on the blue “Edit” button; to remove a previously selected column, click on the red Minus sign.
Note the following:
Column Name. The name of the field you wish to filter on.
“Is” or “Is Not”. Defaults to “is”. Click next to this word and choose “is not” if applicable.
Operator. Defaults to “equal to”. Click next to this word and choose any other operator if applicable. See “Operator Notes” for details.
Compare Value. The value to compare the selected column’s value against. This may contain a constant value, a value from another database field, a calculation, a date substitution, or a question mark. (See following section.)
Type. The type of data the selected column contains. Leave with its default unless doing a date calculation (use ‘number’) or comparing against another database field or calculated value (use ‘literal’).
“And / Or”. The ability to specify “Boolean” logic, e.g., (“look for condition ‘a’ and/or condition ‘b’”). The “and/or” logic is sequential; this means that a filter’s “and/or” applies to the current filter in relation to the next filter. Parenthetical or “grouped” and/or logic is supported. See “And/Or Logic”.
Optional Prompt. The optional prompt is used only with parameter driven filters; see “Parameter-Driven Filters” for details.
Comparing a Column against a Constant Value
Example: “ship via = FedEx”
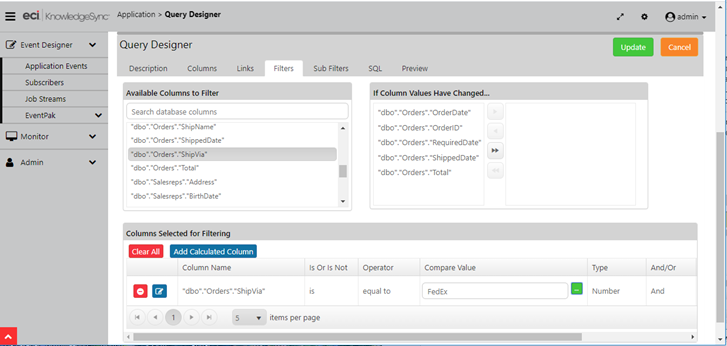
COMPARING A COLUMN VALUE TO A CONSTANT VALUE
You can manually enter the compare value, or you can choose it from a drop-down list. KPI Monitoring is case-sensitive. To select the value from a list, follow these steps:
- Click on the green “…” button in the “Compare Value”field.
- Click on the list button under the heading “Type in a Value or Choose from dropdown List”. This will display a list of possible entries for this field.
- Choose the value that you wish to compare the column to and click on “OK”.
The dropdown list shows values that have appeared in this field in the underlying database. It does not display all possible values that could appear there.
Comparing a Column against another Database Field
Example: “shipped date is later than the required date”
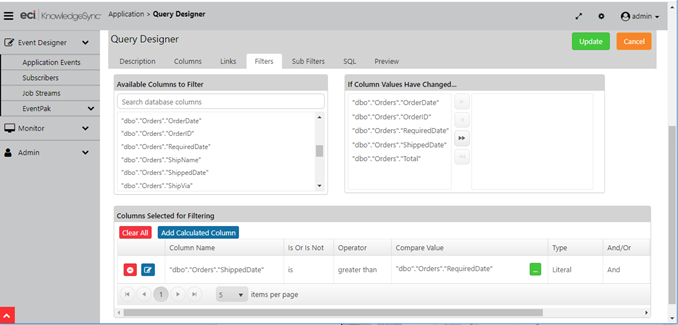
COMPARING ONE COLUM’S VALUE AGAINST ANOTHER COLUMN’S VALUE
To do this:
Click in the “Compare Value” field and delete the ‘?’ that appears there.
Type in the full name (“table.column”) of the field you wish to compare the selected column to (e.g., “dbo"."Orders"."RequiredDate”).
Go to the “Type” field and select “Literal” (so that KPI Monitoring recognizes the ‘compare value’ as a database column name).
Comparing a Column against a Date or Numeric Range
Example: “order total is greater than $99 and less than $999”
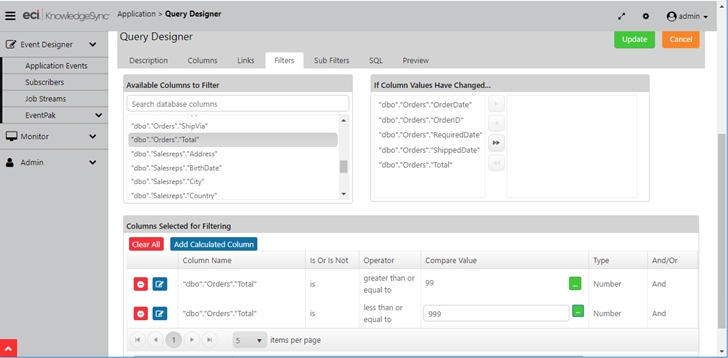
COMPARING A FIELD AGAINST A DATE OR NUMERIC RANGE
A common request is to see if records fall within a date or numeric range. Although you can use the “between” function, use of this operator is not suggested, as this operator tends to execute less efficiently than using a combination of “greater than or equal to” and “less than or equal to”. Additionally, not all database query methods support “between”, and this operator cannot be used in parameter-driven filters.
To create a range filter, follow these steps:
- Select (as filter #1) the field that you wish to perform a “range” test on.
- Choose the operator “greater than or equal to”
- In “Compare Value”, remove the ‘?’ symbol and key in a “beginning” range (such as a “start date” or lowest allowable threshold).
- Make sure the “And/Or” option reads “And”.
- Add a second filter on the same field as filter #1.
- Choose the operator “less than or equal to”
- In “Compare Value”, remove the ‘?’, key in an “ending” range (such as an “end date” or highest allowable threshold).
Comparing a Column against a Date Substitution Variable
Example: “order date = today”
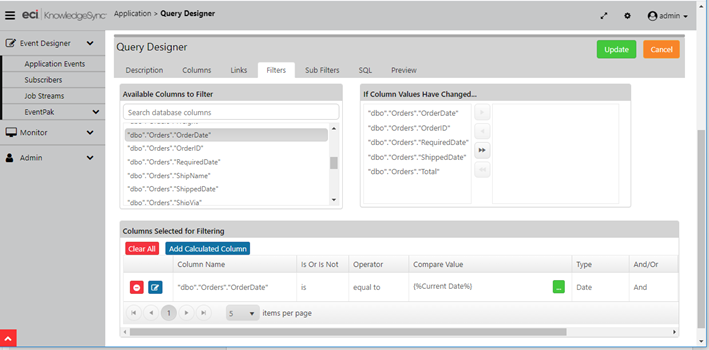
COMPARING A FIELD AGAINST A DATE SUBSTITUTION VARIABLE
Many queries test the value of a date field against a value such as “today”, “tomorrow”, “last week”, or “next month”. KPI Monitoring provides a wide variety of “date substitution variables” that can be used as the “Compare Value”.
To use a date substitution variable as a compare value, follow these steps:
Click on the “…” button in the “Compare Value” field. In the resulting window, look for the list of “Variables to use in calculation”.
There is a wide variety of variables to choose from. You will see multiple formats for the same variable. The choices without any formatting suffix will use your system’s regional settings for its default date format.
Double-click on the value that you wish to compare the column to and click on “OK”.
Be careful when using the “current date” variable if you are comparing it against a field that contains both the date and time. A field that contains today’s date and time will always be greater than (and not “equal to”) the “current date” variable.
You can address this either by configuring your filter see if the date/time field is greater than or equal to today’s date, or by configuring your filter to see if the date/time field is greater than “{%Current Date%} 00:01” and less than “{%Current Date%} 23:59”.
Identifying “New” Records
You can configure a filter to retrieve records with a create date of “today”, and since KPI Monitoring remembers what records have already been triggered, it will not notify you repeatedly about the same records.
But KPI Monitoring has a special date variable that makes this process more efficient – it’s a variable called “Last Date/Time Event Checked”. This variable allows a query to retrieve records that have been added to your database only since the last time KPI Monitoring ran the event.
This is particularly useful if your database is quite large or you are running an event very frequently (e.g., every hour or less).
This variable will be formatted according to the KPI Monitoring server’s regional settings for date format.
Pervasive & Providex Date Formatting
PSQL and Providex databases typically store their dates in "YYYY-MM-DD" format. Thus to compare a date value from one of these databases to a date variable, you would typically use a variable which shows the matching format, such as:
{%Current Date YYYY-MM-DD%}
Parameter-Driven Filters
Requirement: “3 events; for invoices coming due in 7, 14, and 30 days”
Sometimes it’s more efficient to create queries whose triggering conditions are specified on the event level as opposed to (or in combination with) a query’s filters. For example:
Invoices due for payment in the next 7, 14, and 30 days
In this scenario, you could create 3 queries (one query for each triggering threshold), or you could create 1 query – where the “number of days” is a threshold (“parameter”) specified on the event level. A “parameter-driven” query enables you to use the same query in multiple events, each event having a unique triggering parameter (such as ‘7’, ‘14’, or ‘30’ days).
A parameter-driven filter is represented by the ‘?’ symbol in the Compare Value field of a query – the ‘?’ indicating that the compare value will be specified on the event level.
Events using parameter-driven filters will require that a compare value be specified at the time that the event is configured. Once the event is configured, the parameter will have a specific value which is used every time that the event is executed.
The operators “one of”, “between”, and “null” may not be used as parameter-driven filters.
To set up a filter to be parameter-driven, follow these steps:
- Select the column to be filtered and its operator.
- Make sure that a ‘?’ appears in the “Compare Value” field.
- In the “Columns selected for filtering” window, scroll the window to the right until you see the field called “Optional Prompt.” The optional prompt is the text that will appear (on the event level) when this query is selected for use with an event. (The “optional prompt” appears within an event using a parameter-driven query filter. The “prompt” refers to the text that will inform a person that a triggering value is required for this filter, such as “How many days until an invoice is due?”)
The value for a parameter-driven filter must be specified when the event is configured, as KPI Monitoring will not prompt for any values when the event is scheduled to run.
For a parameter-driven filter, delete the default optional prompt text and key in your own text, such as:
o “Select a Priority:”
o “Status is:”
o “Date Range Begins” or “Date Range Ends”. (This requires two parameter-driven filters on the same ‘date’ field.) Your filters will look like this:
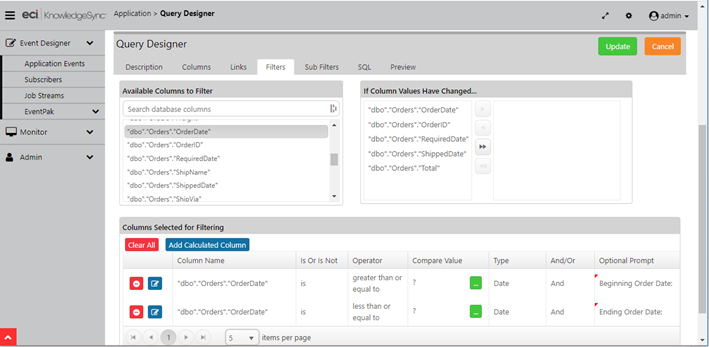
MAKING A FILTER “PARAMETER-DRIVEN”
Checking a Column Against a “Changed” Value
Example: “credit status has changed”
KPI Monitoring can tell you when the value in a data field (column) has changed. When a “data change” event runs for the first time, KPI Monitoring stores the value of the field(s) being monitored for a change.
The next time (and every subsequent time) the event runs, it compares the “current value” of the field(s) being monitored to the “old value” from the previous run. If the two values are different, the event is triggered and KPI Monitoring replaces the “old value” with the “new current value”. And the cycle begins again.
Note the following about “change-based” queries:
They may check for changes to fields in the query’s primary table only.
They must have a unique column, this column cannot be a calculated or edited column, and its “Customized Name” must not be changed from its default value.
If the database you’re monitoring supports “auditing”, it’s more efficient to build queries to monitor that database’s audit table rather than using changed-based queries.
If you have multiple events checking for a change in the same field, these events must be scheduled to run at the same time (e.g., daily at 9:00 AM).
You can check to see if a field value has changed, or if it has changed to a specific value.
If a query monitors multiple “change” fields, KPI Monitoring assumes an “OR” relationship between them.
If a query includes “change-based” criteria and standard filter criteria, KPI Monitoring assumes an “AND” relationship between them.
Any events using a change-based query must have “Repeat Notification for Triggered Items”) checked on.
When you Preview a query, the “change” logic is ignored.
Change-based queries are possible only for tables that have a single-column unique. If a table uses a multi-column unique, please create a view for that table that has a single-column unique value.
Selecting a Column for Value-Change Tracking
To create a filter that checks to see if a value has changed, go to the Filters window titled “If Column Values Have Changed” and you’ll see the columns from the query’s primary database table. To select a column for change-tracking, select the column from the left and click on the right-arrow button to move it to the right.
You may add additional filters, including a filter on the current value of your “change field” to check for records whose content has changed to a specific value.
Storing & Reporting On “Changed” Values
To store the history of when a “changed value” event has been triggered, it is suggested that you use the “Create File” action to create an audit trail. This lets you store the details of what records were changed, when they were changed, and what the old and new values for the change are.
Filter Operator: “One Of”
The “one of” operator lets you test a column for any one of multiple values such as:
Send an alert for any calls that have a priority of ‘A’ or ‘B, or ‘C’.
To use the “one of” operator:
- Select “one of” from the operator list.
- Click in the “Compare Value” field and remove the ‘?’.
- Click on the “…” button in the “Compare Value” field.
- In the “Type in a Value” field, either key in the individual compare values (pressing ‘Enter’ after each entry), or choose the compare values from the drop-down list.
- Click on “OK” when complete
The “one of” operator may not be parameter-driven.
Filter Operator: “Between”
The “between” operator is a slow-executing one, and as such we suggest that you use the combination of the “greater than or equal to” and “less than or equal to” operators in place of the “between” operator wherever possible.
The “between” operator may not be parameter-driven.
Operator: “Starting With”
The “starting with” operator lets you locate any database records that have a field whose value starts with a certain string of letters, numbers, and/or symbols. To use the “starting with” operator, follow these steps:
- Select “starting with” from the operator list.
- Edit the “Compare Value” field and type in the first few characters of the string that you wish to use for matching purposes.
- The “starting with” operator may be parameter-driven.
Operator: “Like”
“Like” is similar to “starting with” except that it lets you locate records that have a field whose value contains a certain string of letters, numbers, and/or symbols.
“Starting with ‘brit’” will retrieve “Britain” and “Britannia” but not “New Britain”.
“Like ‘brit’” will retrieve all three values.
To use the “like” operator, follow these steps:
- Select “like” from the operator list.
- In the “Compare Value” field, enclose the text you wish to monitor for within percent signs, as in “%brit%”.
The “like” operator may be parameter-driven.
Operator: “Null”
You might wish to check to see if a field’s value is blank; but a “blank” value can be either blank or null. To test a field for a blank value, leave the compare value field blank. To test a field for a null value, follow these steps:
- Select “null” from the operator list.
- Remove any value in the compare value field.
If you are not sure how an application identifies an “empty” field, you might want to create a query with two filters – one that tests for blank, and one that tests for “null”. Be sure to use the “or” condition between them.
Using Calculated Fields in Filters
Please refer to the earlier section of this chapter titled “Calculated Fields” – and be sure that the query filter’s “Type” field (“data type”) refers to the correct type of data being returned by your calculated field.
Note:
Calculated fields can be used in both a filter’s column name field and in the compare value field. Calculated field filters may be parameter-driven.
And/Or (“Boolean”) Logic
Consider the following scenario:
Notify me about new orders for greater than $99 and . . . . . . that have freight charges less than $5,
or: . . . that have freight charges more than $50
This type of “and/or” (“boolean”) logic requires the ability to group filters together, using parenthetical expressions. Each filter that you create automatically has an “and/or” associated with it – and those words apply to the current filter AND the filter that follows it. If there is no following filter, the “and/or” has no effect.
So – to create the preceding scenario:
Create the three filters the query needs:
- Orders greater than $99; (“and”)
- Freight charges less than $5; (“or”)
- Freight charges more than $50; (“and/or” does not apply)
Edit the “Column Name” of filter #2 and place a left parentheses in front of the name.
Edit the “Compare Value of filter #3 and place a right parentheses after the compare value.
Note: If the compare value is a character or date, place single quotation marks around the compare value, and change the “Data Type” to “Literal.”.
Your Boolean filters will look like the following:
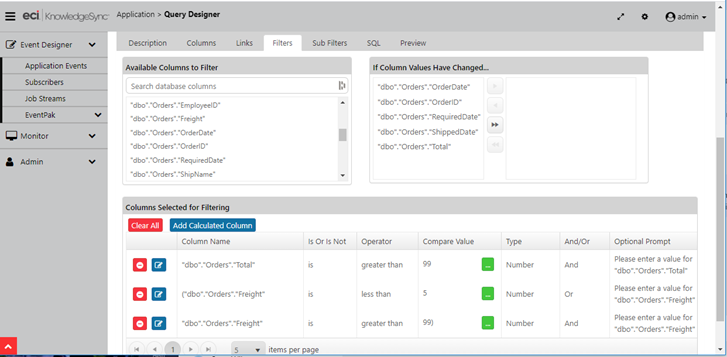
BOOLEAN (“AND/OR”) LOGIN IN FILTERS
Sub-Filters
Sub-filters are not used with record-level or data-change queries; they are used only with aggregate queries and will be discussed in this chapter’s section on aggregate queries.
Query SQL
KPI Monitoring Technical Support does not support manually-edited SQL.
The “SQL” tab lets you review the SQL syntax that a query is executing. There is rarely (if ever) the need to make direct changes to a query’s SQL. Once you start manually editing query SQL, all subsequent changes to the query must be done through the SQL tab.
If you wish to manually edit the SQL, place a checkmark in “I would like to manually edit the SQL for this query” box. It is essential that you select all needed columns for a query and identify the query’s unique column before you manually edit a query’s SQL.
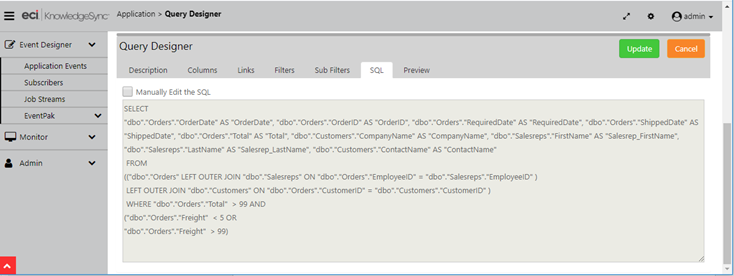
QUERY “SQL” SYNTAX
Once you manually edit the SQL syntax, any modifications that you make to any of the other query definitions tabs will not be retained.
If you edit a query’s SQL and then de-select the manual editing option, the query will re-constitute the SQL syntax based on the content from the other query tabs.
Using a Stored Procedure in a Query
To use a stored procedure instead of a query, follow these steps:
- Select the option “I would like to manually edit the SQL for this query” (see preceding section).
- Type in the procedure name, as in “dbo.myprocedurename”
- To pass parameters into your procedure, use the following syntax:
“dbo.myprocedurename param1,param2,param3” - (Parameters that are string values must be enclosed by single quotes.)
As stored procedures are custom elements in KPI Monitoring, our Technical Support Services are not able to assist you in debugging these procedures.
Preview
The Preview tab lets you verify that your query is running as you wish it to.
Don’t wait until you have built every aspect of a query before previewing it. Use the preview function repeatedly as you add more and more elements to a query and begin to refine its criteria.
When you click on “Preview”, KPI Monitoring will return any records that meet your query’s criteria. If the preview tab is blank (containing no records), it means that no records met your criteria. When Preview mode returns matching records, it will appear similar to the following:
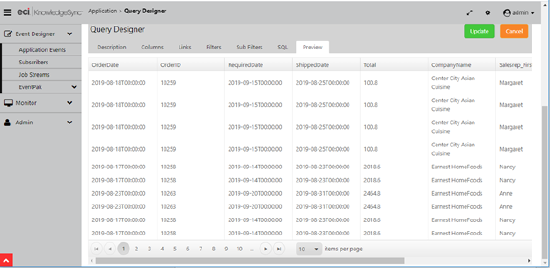
QUERY “PREVIEW”
If you receive an error message when previewing, it means that KPI Monitoring was not able to successfully execute your query. The most common reasons for this are:
- The database connection (e.g., .NET Provider, ODBC, OLE/DB) for this application was not correctly configured
- Multiple tables for this query were not correctly linked
- Your query includes calculated fields that contain invalid SQL syntax
- You have specified an invalid customized name for a query column
- You have specified an invalid filter
- You have edited the underlying SQL and introduced a syntax error
- You have referenced a SQL function not supported by your database connection
If your query includes parameter-driven filters, you will be prompted to enter corresponding values; if the filter requires date values, you will be able to choose from KPI Monitoring’s date substitution variables.
Saving a Query
To save your query, click on the “Save” or “Update” buttons.
Copying a Query
To make a copy of a query, follow these steps:
- Highlight (single-click on) the query you wish to copy.
- Click on “Copy Query.”
- Click on “Paste Query.”
- Go into either of the two (identical) queries and modify it as needed – and don’t forget to change the query’s description!
Deleting a Query
Before deleting a query, make sure that no events use it. If you delete a query that is linked to an event, the event will fail to execute successfully. To delete a query:
Under the list of “Query Definitions”, locate the query you wish to delete and scroll the window as far to the right as possible.
Click on the red “Minus” button at the far right.
Caution! There is no “Undo” option once you have deleted a query.
Locating a Specific Query
To locate a specific query, you can either use the page numbers at the bottom of the “Query Definitions” window, or you can use the “Search Description” field to type in all or part of the name of the query you’re looking for and (if it exists), you’ll be brought to the desired query.
Aggregate Queries
Aggregate queries are queries that are triggered by a group of records that collectively meet a certain condition. For example:
- More than 10 open service calls with a priority of “critical”
- Fewer than 5 forecast sales due to close next week
- Clients who have purchased more than $50,000 of a specific product.
Aggregate queries do not retrieve “details” about individual records; instead, aggregates queries retrieve data pertaining to the aggregate condition being met. For example:
- Condition to Monitor for: More than 10 open service calls
- Condition that Exists: 14 open service calls
- Query Retrieves 1 Record: “14”
- Condition to Monitor for: Clients with > $1,000 in sales last month
- Condition that Exists: 3 matching clients
- Query Retrieves 3 Records: “Smith 2500”, “Jones 1300”, “Davis 3100”
Aggregate queries cannot use “change-based” filtering.
Aggregate “Grouping” Results
One of the benefits of aggregate queries is that they can “group” their results based on any fields in a database. Consider the following three examples and the results from corresponding aggregate queries:
KPI Monitoring can “count” the number of records that meet certain criteria. For example, an aggregate query that counts the number of orders today could yield the following result:
17
An aggregate query that counts the number of orders per region today could yield the following result:
6 Northwest
3 Southwest
8 Eastern
And an aggregate query that counts the number of orders per salesrep within each region today could yield the following:
3 Northwest Karen Chavez
2 Northwest Dave Bruce
1 Northwest Sue Murphy
Aggregate Query Configuration
Please read through the earlier (record-level) query design section of this chapter before proceeding with the following sections. The instructions on aggregate query configuration assume that you are familiar with record-level query design and so the following sections will focus only on those areas of aggregate query design that are different from record-level queries.
Aggregate Query Columns
An aggregate query’s columns are selected based on the following three criteria:
The field that the aggregate function will be performed on
The “group by” field(s)
Other fields to appear in the alert message, contain a recipient’s address, or will be used in an event’s actions
Aggregate Function: Summarize
- The “summarize” function lets you total the amounts in a numeric field, for example:
- The sum total of dollars of sales received today
- The sum total of minutes spent on high priority support calls
- The sum total of units of a particular item sold this month
Aggregate Function: Average
- The “average” function lets you derive the numeric average for a field, such as:
- The average sale price this week
- The average length of a support call in minutes
- The average percent of damaged received goods
Aggregate Function: Count
- The “count” function lets you count the number of records that meet certain conditions, such as:
- The count of overdue invoices per client
- The count of activities scheduled per rep today
- The count of current backorders for a specific stock item
Aggregate Functions: Maximum & Minimum
- The “maximum” and “minimum” functions let you identify the maximum or minimum values for a field. This function is for such things as:
- The maximum sale closed last week
- The minimum order quantity this week
- The most recent contact date for a client
Aggregate Grouping
When working with aggregate queries, you need to consider not only what you want to perform the aggregate upon (e.g., total sales) but whether you wish to “group” the results of that aggregate (e.g., sales total by salesrep).
The ability to create aggregates that group their results is one of the most powerful aspects of aggregate queries. Consider how you can take an ordinary aggregate query such as “total sales” and create the following by adding one or more “group by” fields:
- Total sales by salesrep
- Total sales by region
- Total sales by product line
- Total sales by region and (within region) by product line
- Total sales by regional sales manager
All aggregate functions support grouping, but grouping is most commonly used in “summarize”, “average”, and “count” aggregate queries.
How to Configure an Aggregate Query
To select columns for a “summarize”, “average”, or “min/max” query, follow these steps:
- Identify the aggregate condition you wish to perform (e.g., you wish to “total” the sales amounts).
- Select the table that contains the field you wish to perform the aggregate function on (e.g., the sales amount is stored in the “orders” table).
- Select the column you wish to perform the aggregate function on (e.g., the “total” column from the “orders” table). The aggregate column is usually the first column selected in an aggregate query; the exception to this is aggregate queries that retrieve data for charts. Those queries need to have their “group by” value selected first, and the aggregate value selected second.
- Under “Selected Columns”, click next to the word “Normal” in the Column Type field to display the list of aggregate functions and select the appropriate function (e.g., “Summarize”).
- Change the customized name of this column to reflect that this field contains an aggregate total (e.g., “sales_total”).
(Do not put the aggregate function name at the start of a customized name (e.g., “total_sales”) as some databases do not allow this.) - Go back to the list of available columns and select your “group by” field(s) (e.g., select the “customer” column to total the sales by customer).
Your query will look similar to the following:
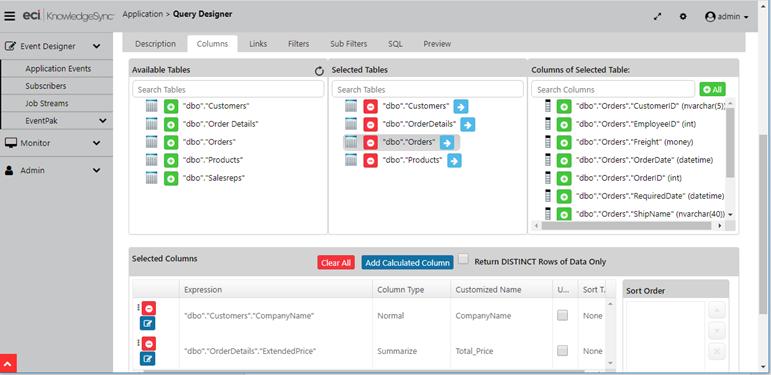
AGGREGATE “SUMMARIZE” FUNCTION: TOTAL SALES PER CUSTOMER
The “Count” Function
To create an aggregate “count” query, do the following:
- On the Columns tab, choose the column that’s the primary key (or “unique”) for the table whose records you wish to count
- Click next to the word “Normal” in the Column Type field and select “Count.”
- Change the “Customized Name” as appropriate
- Select your “group by” field(s)
Your result will look similar to the following:
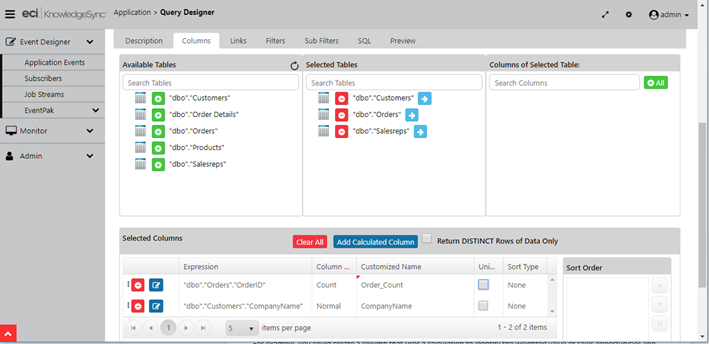
AGGREGATE “COUNT” FUNCTION: NUMBER OF LATE DELIVERIES PER CUSTOMER
Additional Column Selections
Here are a few tips for choosing additional columns in your aggregate query:
Make your “group by” field as informative as possible. For example, to display total sales per salesrep, do not make your “group by” field the salesrep’s ID, but rather the salesrep’s full name.
To send the results of a query to the individuals that are identified within the query, include the column that contains the delivery address that the alert will be sent to (e.g., include the salesrep’s email address as a query column).
A single query can have multiple aggregate fields. E.g., a query could count the number of jobs last month and show the total cost of those jobs by using both the “count” and “summarize” functions.
The “Unique” Field
The “Unique” field does not apply to aggregate queries; you may skip specifying a unique column for an aggregate query.
Aggregates and Calculated Fields
Calculated fields may be used with aggregate queries in the same manner that they are used with record-level queries. For example, you could create a column that uses a calculation to identify the weighted value of sales opportunities and then use the “summarize” function to total that value.
Sort Type / Sorting Order
(See “Sorting”, earlier.)
Filters
Aggregate queries use filters to determine which records are to be included in the aggregate calculation. For example, a query that checks to see if there are more than 6 open, high-priority support calls uses filters to limit the potential records to only those calls that are open and have a high priority.
In this regard, filters for aggregate queries are handled in the same manner as filters for record-level queries.
Aggregate queries cannot use the “If Column Values Have Changed” function.
Sub-Filters
Sub-filters are used only with aggregate queries; it is the sub-filter that tests the result of the aggregate calculation to see if it meets certain criteria.
For example, in an aggregate query that “counts” the number of open, high priority support calls to see if there are more than 6, the sub-filter is what checks to see if the number of calls exceeds 6. (And it’s the query’s standard filters that tell KPI Monitoring to look only at calls that are “open” and “high priority”.)
The following queries have their sub-filters highlighted:
- Total sales of less than $10,000 per region
- Average discount percent of more than 15%
- More than 10 open support calls per agent
Sub-filters configured as follows:
Click on the “Sub-Filters” tab.
- Column Name. From the list of “Available Columns to Filter” select the aggregate column you created earlier.
- “Is” or “Is Not”. Defaults to “is”; click and choose “is not” to change.
- Operator. See “Operator Notes” earlier for details.
- Compare Value. Specify a constant value, a database field name, a date substitution value, or the question mark. (See earlier in chapter for details.)
- Type. The type of data the aggregate column contains. Leave with its default unless comparing against another database field or calculated value (use ‘literal’).
- “And / Or”. Since a query can include multiple sub-filters, this gives you the ability to specify “and/or” logic in the sequence of your sub-filters.
- Optional Prompt. Used only with a sub-filter that is parameter driven (has a ‘?’ in the Compare Value field). See the section titled “Parameter-Driven Filters” for details.)
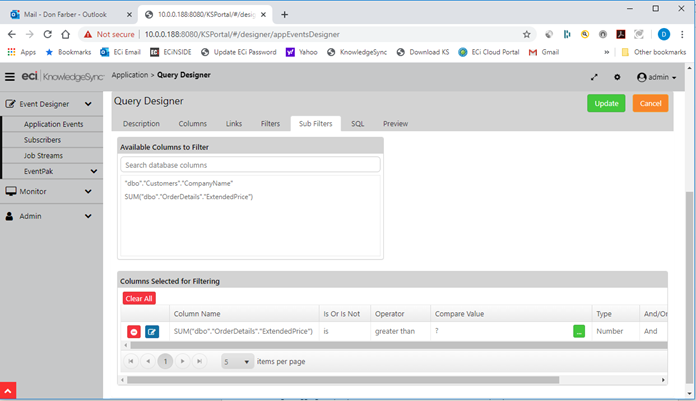
AGGREGATE QUERY SUB-FILTER
SQL Tab (for Aggregate Queries)
See “Query SQL”, earlier.
Preview (for Aggregate Queries)
Previewing an aggregate query is the same manner as for a record-level query:
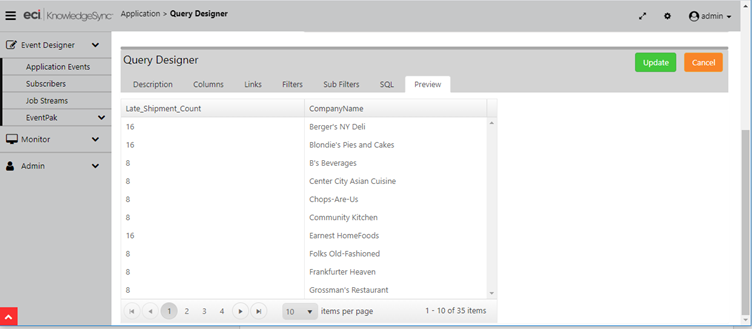
AGGREGATE QUERY PREVIEW MODE
Linked Queries
A single event can use multiple queries. Consider the following examples:
- Check for more than 20 open service tickets and more than 3 support reps absent from work today.
- Check for clients whose orders totaled less than $5,000 over the last month and called into support more than 5 times during that timeframe.
- Check for clients who have open sales in a CRM app and are on credit hold in an ERP app.
Each of these events requires two queries each.
The first example requires no “linking” between the queries, because the result sets have no data in common with each other. In such cases, you simply create each query independently and associate both queries with a single event.
(When multiple queries are associated with an event, KPI Monitoring automatically assumes an “and” correlation between them.)
In the second and third examples, however, the queries must be linked to each other because the result sets do have data in common – the “client”. This requires additional query design considerations.
Data-change queries cannot be linked to any other queries.
How Queries are Linked
If you determine that you need two (or more) queries to identify whether a business condition exists, the first thing to decide is whether the queries will have some data in common with each other. Consider the example given previously:
Check to see if a client has purchased less than $5,000 over the last month, and has called into support more than 5 times.
This scenario requires one aggregate query to “sum” a client’s sales, and a second aggregate query to “count” the client’s number of support calls.
What makes this scenario unique is that both queries need to retrieve their results for the same clients – and the “client” is referred to as the queries’ “linking field”. Here’s how to “link” these queries:
- Identify the linking field (“client ID”).
- Decide which query will go first.
- Design query #1 (e.g., “Clients Purchasing < $5k”)
- Go to the “Columns” of query #1 and be sure to include the linking field as one of the columns for this query.
- Modify the Customized Name of the linking field to something memorable (e.g., “client_link”).
Design the “Link to” Query
The second query should identify that it is a “link to” query, so give it a description such as “Clients with > 5 Support Tickets (Link To)”. Design this query as per its requirements and then (to create the link with query #1) follow these steps:
- Go to the “Filters” of query #2.
- Add a filter on the linking field (e.g., the “Client ID” field).
- Select an operator of “is equal to”.
- In the Compare Value field, key in (within curly braces) the customized name of the linking field from query #1 {client_link}.
By designing your “link to” query in this manner, it will automatically retrieve records for the same client as query #1. The following is an example of this:
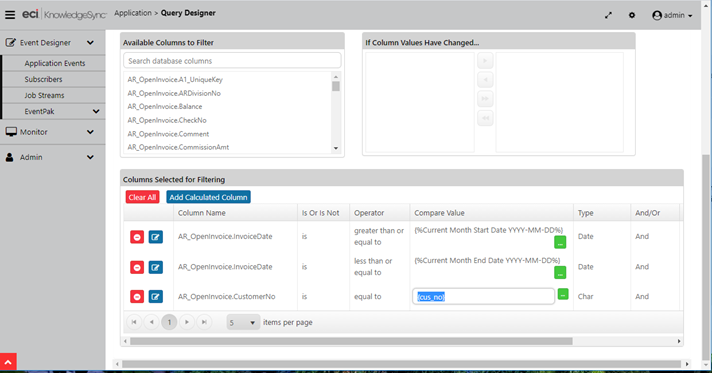
“LINK TO” (COMPARE VALUE) LINKING SYNTAX
Please note :
- A “link to” query will execute successfully only if it follows a preceding query containing the appropriate customized name. Do not use a “link to” query stand-alone in an event; it will not execute successfully.
- You can have up to 99 linked queries in a single event.
- A link-to query should not use a “group by” value. For example, if the link-to query “counts” the number of activities for a specific client, the query should have only a single column (the field to be counted) and the filter will perform the linking function.
- The link-to query cannot be used to retrieve “advanced” subscriber information. This information must be retrieved by the initial query.
- You can link queries from the same application or from different applications; the technique is the same (identify a “linking field”.)
Data Manipulation between Linked Queries
One of the special benefits of linking queries is that it enables you to use data from query #1 in query #2. Consider the following example:
Note: When a sales opportunity is placed in a CRM application, you want KPI Monitoring to take the value of that sale, add it to the client’s current balance in an ERP application, and then see if that total is greater than the client’s credit limit.
When you link queries together, data from the first query can be used in the second query’s “Columns”, “Filters”, and “SubFilters”. Like the linking field, all fields are referred to using their customized name within curly braces, as shown below (note format of column name selected for filtering):
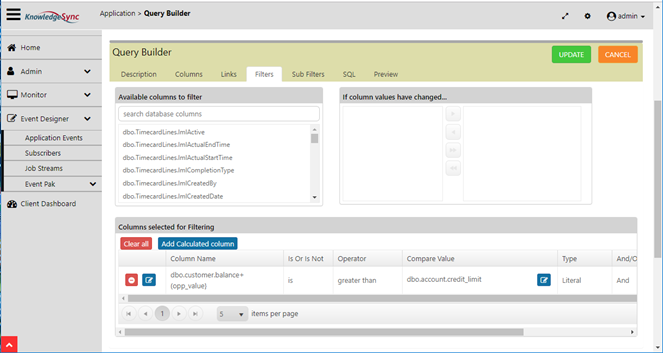
DATA MANIPULATION BETWEEN LINKED QUERIES
A field from a previous query needs to be referred to using its customized name enclosed within curly braces.
When an event uses multiple queries, all of the data fields (from all preceding queries) are available to be used in a subsequent query, and all data from all queries is available to be used in the event’s alert messages, report selection criteria, and event workflow.
Database Triggers
In addition to using queries to identify database conditions, KPI Monitoring supports the use of web service calls (via a REST API) as well as database triggers (which are embedded within external applications) to know when records are added, changed, or deleted.
Please use the KPI Monitoring on-line knowledgebase (or contact KPI Monitoring Support) to get examples of web service calls as well as database triggers and their use in KPI Monitoring events.