CCH KPI Monitoring : Monitoring Events

Monitoring Events
The KPI Monitoring Monitor lets you keep track of:
- The status of the application’s servers
- Events that are scheduled to be checked and have been triggered
- Alerts that are queued to be delivered, and have been delivered
- The text of the outgoing email alert messages
- The status of forms, documents, and reports queued for delivery
- The status of workflow actions queued for execution
- The status of any system errors
The Monitor can also be used to “correct” or delete the information that appears within it, based on a KPI Monitoring user’s authorizations and permissions.
The Watchdog EventPak
KPI Monitoring can monitor itself, and there is a collection of events that perform this function. It is referred to as the “WatchDog EventPak” and it may be downloaded from the KPI Monitoring downloads page. The Watchdog monitors and reports on:
- Event errors
- Alert delivery errors (e.g., an invalid phone number)
- Too many alerts
- Too many alerts to one person
- Form, document, or report generation errors
- Workflow errors
- Alerts or actions pending for more than 'x' minutes
The Monitor
When you click on the Monitor from the main KPI Monitoring window, the first branch (“Activity”) shows you the status of KPI Monitoring’s servers:
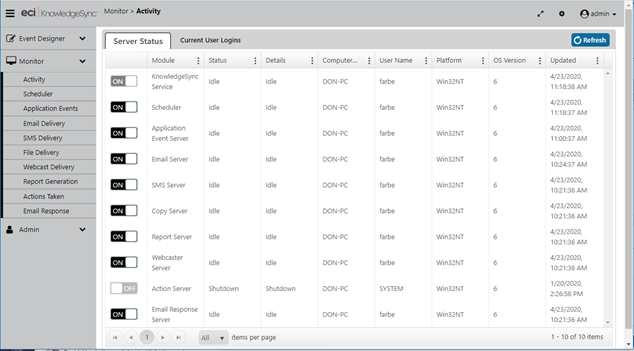
KNOWLEDGESYNC MONITOR : “ACTIVITY”
Activity Folder
This window is a listing of all of KPI Monitoring’s servers, whether they are enabled to run (the first column, which can be toggled on or off), the “status” column (showing whether a server is currently running), and the “details” column (showing the text of any error messages encountered by the server).
You can optimize system resources by disabling (toggling “off”) one or more servers if your configuration of KPI Monitoring will not be using that server’s functionality. (For example, if you will not be sending alerts via web dashboard (webcasting), you can toggle this server off so that it uses no system resources.
8.2.1.1 Server Status
This displays the current status of the application’s servers. Possible statuses are:
- Shutdown: The server is not running at this time. This could be due to the application service not running, the individual server being disabled, or an error that caused the shutdown of the server.
- Idle: The server is running but is not processing any data.
- Processing: The server is processing data.
- Startup: The server is starting up. Startup mode should not last for more than a few seconds; if it does, try re-starting the application’s Windows service.
- Linking: Subscriber linking (see “Subscribers” chapter) is in progress.
KPI Monitoring uses the following servers:
- KPI Monitoring: This server initiates all of the other servers.
- Scheduler: This server schedules events, alerts, reports, and workflow.
- Application Event: This server executes events.
- Email: This server delivers email messages.
- SMS: This server delivers text messages.
- Copy: This server copies and delivers files and reports via FTP/SFTP.
- Report: This server generates Crystal and SSRS reports, forms, and documents.
- Webcaster: This server delivers dashboard (webcast) messages.
- Action: This server executes workflow actions.
- Email Response: This server handles the processing of incoming email monitored by KPI Monitoring
If any of the first three servers are shutdown or paused, KPI Monitoring will not be able to check for events, send alerts, generate reports, or execute workflow.
If any of the notification servers (i.e., email, copy, text or webcast) are shutdown or paused, KPI Monitoring will not be able to send alerts via those methods.
If the “Action” server is shutdown, KPI Monitoring will not be able to execute workflow actions and/or trigger updates into one or more application databases.
Current User Logins
This option tells you who is logged into KPI Monitoring, including each person’s login name, login date/time, as well as their platform and browser versions.
Scheduler
The “Scheduler” folder shows you what events are due to be submitted for execution next.
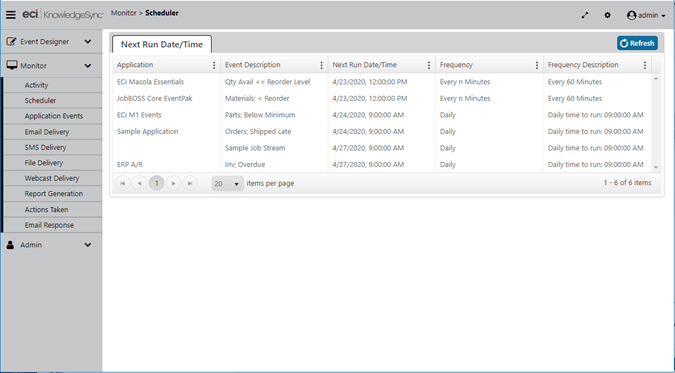
NEXT SCHEDULED RUN DATE/TIMES
For each event you will see its application name, event description, next scheduled run date/time, and the event’s schedule frequency.
Application Events
The “Application Events” folder lets you to track the status of events that are due to run, have already run, or have failed to run successfully because of an error.
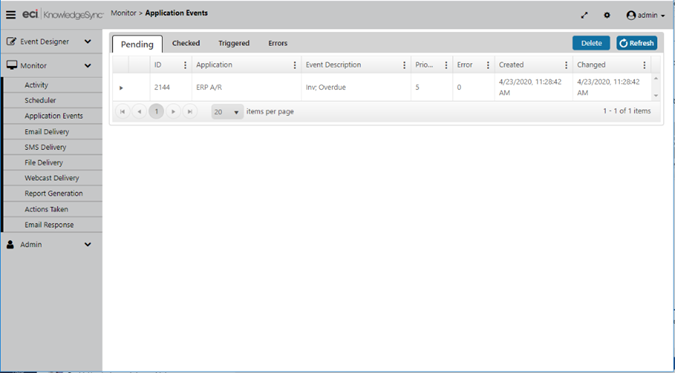
APPLICATION EVENTS: PENDING, CHECKED, TRIGGERED & ERRORS
Application events are divided into four categories:
- Pending. An event is pending because it either is about to be submitted or has been submitted and is in an error state.
- Checked. A checked event is one that was successfully executed. It may or may not be “triggered”, depending on whether its conditions were met.
- Triggered. A triggered event is one that was successfully executed and whose conditions were met. A single run of an event may result in multiple triggered records appearing in the Monitor.
- Errors. An event shows up under “errors” if it was unable to be successfully checked. Such an event automatically is re-queued under “Pending”.
Triggered Records
When an event successfully runs, it will appear once in the “Checked” branch and may appear multiple times in the “Triggered” branch. Consider the following event:
Send an alert to each support rep about any high priority call that has been open for longer than four hours.
There may be multiple call records that meet this event’s criteria and the event may trigger once for each record, once for all records, or once per rep who has high priority calls.
Event Details
For each checked event, you will see the event’s application, name, date/time of execution, and runtime (processor seconds) that the event took to complete.
For each triggered event, you will see the above details plus a blue plus sign that enables you to see the email alert message text, the “deliverables” of the event (its alerts, reports, et cetera), and the value of the unique IDs of the triggered records that have met the event’s criteria.
For an event that ends in error, you will see the event’s application, name, date/time of execution, as well as the number and description of the error that occurred.
Displaying Email Alert Message Text
When on the “Triggered” tab, you may display the full text of the email alert message. To do so, click on the blue plus sign next to an event and then view the tab called “Email Message Text”.
Note: that this tab will not appear if an event is not configured to send alerts via email.
An event’s mail message text will appear such as the following:
DISPLAYING ALERT MESSAGE TEXT
Displaying Event Deliverables
Also, on the “Triggered” tab, you may display an event’s “deliverables” – all of the content an event is configured to generate (such as alerts and reports) as well as all of an event’s workflow actions – such as triggering updates into one or more software applications. You’ll see a window like the following:
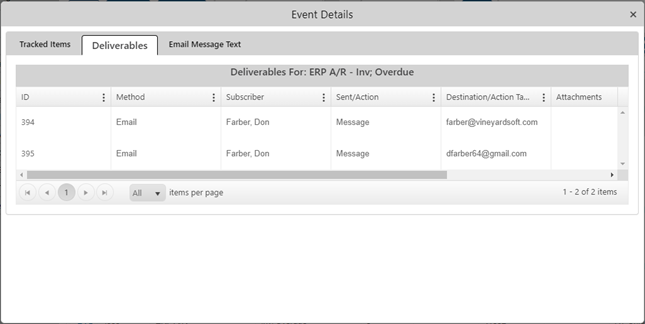
DISPLAYING AN EVENT’S DELIVERABLES
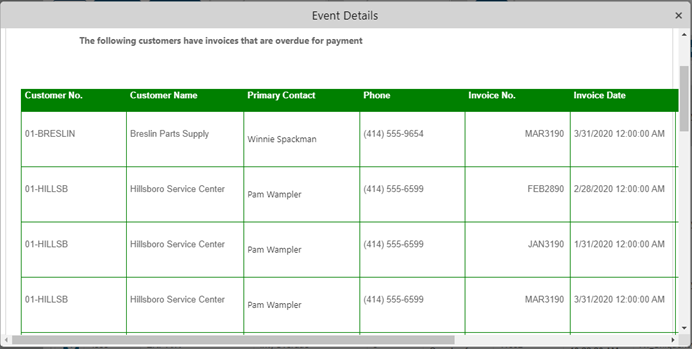
Displaying Event’s Tracked (Triggered) Items
Lastly on the “Triggered” tab, you may display an event’s “tracked items” – the unique record identifications of each record that has met an event’s criteria when the event was triggered. This will look like the following:
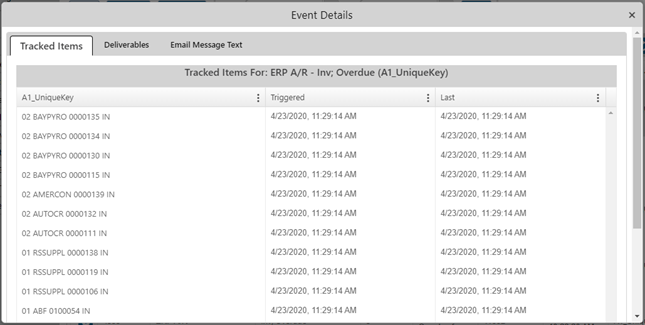
DISPLAYING AN EVENT’S TRACKED/TRIGGERED RECORDS
Note: A record that meets an event’s criteria will remain in a triggered state until (1) the record no longer meets the event’s criteria, and (2) someone has “cleared” the triggered record for that item.
You will not have access to an event’s tracked items if:
- The event’s trigger does not have a “unique” column identified, or;
- The event is configured to “repeat notifications for triggered events”
How to Handle Event Errors
When an event fails because of an error, three things happen:
- The event will appear in the “Errors” branch.
- The event will appear in the “Pending” branch.
- KPI Monitoring will re-submit the event ‘x’ times (a KPI Monitoring system setting) until it either runs successfully, is deleted, or is manually completed.
KPI Monitoring retains only one iteration of an event that errors. If an event errors due to a condition that corrects itself (such as a server down), you can leave the event alone as once the condition is corrected, the event will successfully execute.
If the event errors because of an incorrect configuration, you can edit the event, correct it, and your “fixed” version will be used the next time the event runs. If the event errors and you wish to remove that run of the event, a KPI Monitoring user with the appropriate authorizations may either delete or manually complete the record from within the Monitor option in which the error appears.
Email, SMS, File (FTP/SFTP) & Webcast Delivery
The “Delivery” folders for email, SMS, file and webcast (dashboard) are divided into three branches:
- Pending. A “pending” item is one that has not been sent either because it is currently processing/awaiting processing, or because of the item has encountered an error.
- Sent. A “sent” item is one that was successfully delivered.
- Error. A “error” item will appear if the item could not be successfully delivered. An erroring item will automatically be placed back into the “Pending” branch.
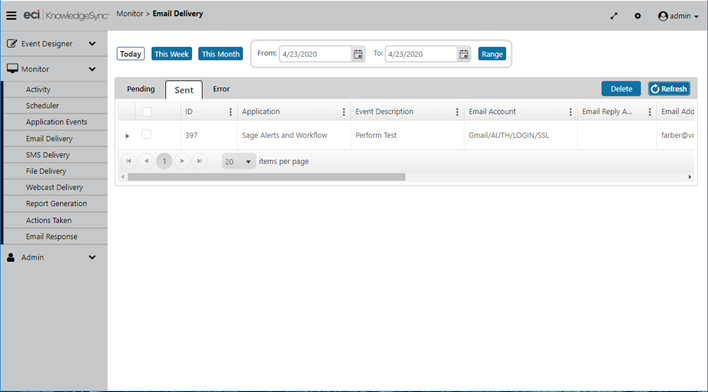
EMAIL “SENT” DELIVERY FOLDER
How to Handle Message Delivery Errors
When a message fails to be delivered successfully, three things happen:
- The message will appear in the “Errors” branch
- The message will appear in the “Pending” branch
- KPI Monitoring will attempt to re-send the message ‘x’ times (determined by a system setting) until the re-send is either successfully delivered or is deleted or manually completed.
Report Generation
The “Report Generation” branch lets you track the status of forms, documents, and reports that an event is generating. This folder is divided into three branches:
- Pending. A pending report is one that has not been generated either because it is currently processing/awaiting processing, or because of the report has encountered an error.
- Generated. A “generated” report is one that was successfully produced. Just because a report was “generated”, it does not mean it was successfully delivered. Review the appropriate delivery method (such as email) to see if the report was delivered to its intended recipients.
- Error. A report will show up under the errors branch if it failed to be generated successfully. A report that fails will automatically be placed back into the “Pending” branch.
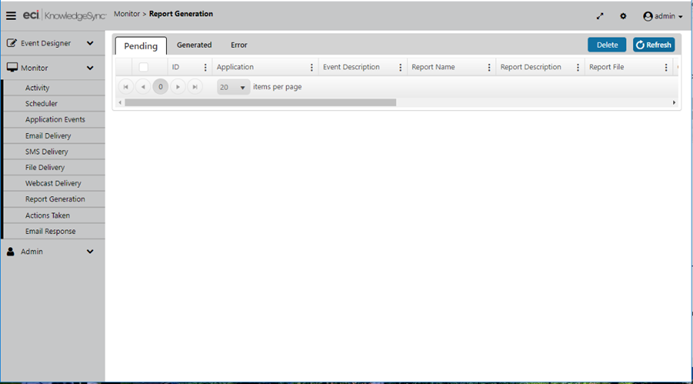
REPORT GENERATION FOLDER
How to Handle Report Generation Errors
Report generation errors can occur for several reasons, typically an error in the report’s design. When a report fails to be generated successfully, three things happen:
- The report will appear in the “Errors” branch
- The report will be re-queued under the “Pending” branch.
- KPI Monitoring will attempt to re-generate the report ‘x’ times (determined by your administrator) until it either succeeds or the report is deleted or manually completed.
Actions Taken (Workflow)
“Actions Taken” refers to events that execute workflow actions in response to a triggered event. This folder is divided into three branches:
- Pending. A pending action is one that has not been completed either because it is currently processing/awaiting processing, or because of the item has encountered an error.
- Completed. A “completed” action successfully executed.
- Errors. An action will show up under “errors” if it was unable to successfully execute. An action that fails will automatically be placed back into the “Pending” branch.
How to Handle Workflow Action Errors
Action errors occur for a number of reasons, such as a syntactical error in a web service call or within a VB script.
When a workflow action fails, three things happen:
- The action will appear in the “Errors” branch
- The action will appear in the “Pending” branch
- KPI Monitoring will attempt to re-execute the action ‘x’ times until it either succeeds or is manually deleted or completed.
Email Response
(See section 'Email Response System' for more details.)
The Email Response folder lets you see what e-mail accounts are being checked for incoming messages, how many messages have been received and loaded into KPI Monitoring, and if any errors were encountered.
Once email message are loaded into KPI Monitoring, the corresponding events are treated just like any other application event, and thus can be tracked using the “Application Events” folder.
The “Email Response” folder is divided into three branches:
- Checked. Incoming email messages that have been checked by KPI Monitoring.
- Received. Incoming messages that have been loaded into the KPI Monitoring email response system database.
- Errors. Errors that KPI Monitoring encountered while trying to check for messages sent to one or more email accounts.
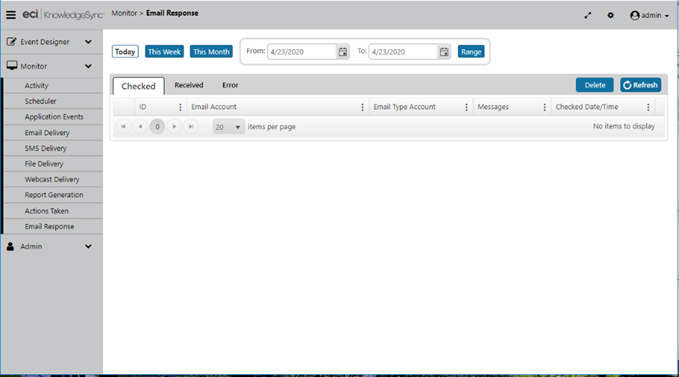
EMAIL RESPONSE SYSTEM ACTIVITY IN THE MONITOR