CCH KPI Monitoring : Dashboard Alerts (Webcasting)

Dashboard Alerts
Dashboard alerts are dynamically created and updated web (HTML) pages that contain triggered event details as shown below:
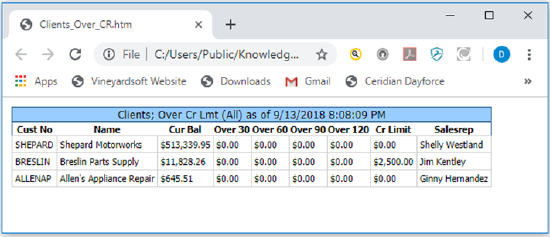
A DASHBOARD (WEBCAST) ALERT
A free “Dashboard Setup Kit” is available from the Documentation page of the KPI Monitoring website.
How Dashboard Alerts Are Used
Dashboard alerts have three distinct uses:
- Task-Specific Dashboards. This is a display of information that pertains to a specific business area – such as “overdue invoices” “low stock”, “unassigned leads”, or “open support calls”.
- Staff & Task-Specific Dashboards. This is a display of information that pertains to a specific user and their tasks – such as “my clients’ overdue invoices”, or “my activities for today”.
- User Alert Listing. This is a display of all alerts – for all business conditions – that apply to a specific user (e.g., “My Alerts”)
What a Dashboard Consists Of
A dashboard consists of the following components:
- A template which controls the overall design of a dashboard window
- An event which controls the data within a dashboard
- Subscribers which specify where dashboard output is generated.
The following steps will walk you through the creation of a single dashboard; one that displays a list of invoices that are currently overdue for payment.
Enable Dashboard Creation
To enable dashboards, follow these steps:
- Expand the KPI Monitoring Monitor option and click on the “Activity” tab.
- Make sure that the “Webcaster Server” shows a status of “ON”. (“webcaster” = “dashboards”). If the webcaster server shows a status of “OFF”, click next to the word “off” to enable this server.
- Restart the KPI Monitoring Windows service.
Create Template
All dashboards have a general layout and design that is controlled by an HTML template. We suggest that you use the standard dashboard template from KPI Monitoring within the “Dashboard Set-Up Kit”. The kit is available from the KPI Monitoring website’s “Support” page, under “Documentation”:
https://www.vineyardsoft.com/downloads-documentation.php
In this kit is the default “dashboard template” which you may, optionally, edit (to include your company name, logo, etc). Note that you must use an HTML editor to make such changes. (Do not edit the template in MS Word, as it will lose its formatting.) You may edit a template using “Notepad” if you have no HTML editor available.
The only “variable” field in this template is called {EVENT_MESSAGE}. This field contains the contents of the “Webcast” deliverable of the event which generates a dashboard.
Storing the Template
We suggest storing your webcast template(s) in a folder called “Webcaster” – you will need to create this folder – and we suggest you do so directly under the KPI Monitoring installation folder, as in the following example:
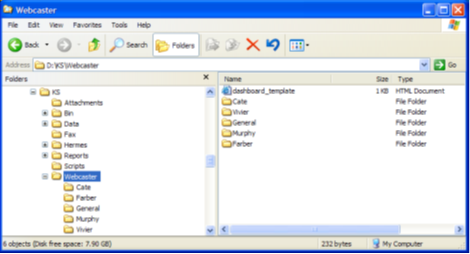
DASHBOARD TEMPLATES LOCATION
Creating Multiple Templates
You may wish to create multiple templates for the following reasons:
- To have different dashboard layouts for different recipients. E.g., you might have one template that is used for your internal dashboards, but a different template for dashboards that are going to be seen by customers or suppliers.
- To have dashboards that reside in different locations for security reasons. Each template has its own “publishing location” and so internal dashboards might be stored inside a firewall, whereas customer dashboards might be stored outside it.
- To create multiple templates, make a copy of the original template, make any necessary changes to the new one, and then save the new template with its own unique name.
Create Publishing Location
You must specify where (system folders) dashboard output is to be generated and stored. This is referred to as a dashboard’s “publishing location”.
Dashboard output may be stored in one folder or in multiple folders. For example, if you wish to create dashboards for users “Smith”, “Jones”, and “Parker”, you might wish to store these dashboards in corresponding folders called “Smith”, “Jones”, and “Parker”.
Plus, if you were creating dashboards for various departments within your organization, you might create folders such “Sales”, “Support”, and “Shipping”.
KPI Monitoring suggests that dashboards be created in sub-folders beneath the KPI Monitoring “webcaster” folder; you may specify other locations if desired.
Add Publishing Location Folder(s)
The steps below show the creation of three (3) publishing locations beneath the KPI Monitoring “webcaster” folder. To create your own publishing locations, follow these steps:
- Open Windows Explorer and navigate to the folder where you installed KPI Monitoring.
- Navigate to the “Webcaster” folder.
- Create a new folder (beneath the Webcaster folder) and give it a name according to the person or group who will be receiving dashboard alerts.
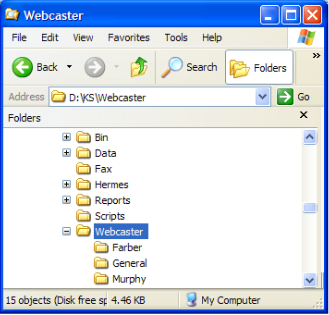
3 PUBLISHING LOCATIONS (“FARBER”, “GENERAL”, & “MURPHY”)
Define “Default” Template & Publishing Location
Although you may define multiple templates and publishing locations, the dashboard alerts module requires that you create a “default” template and publishing location record. This becomes the template that KPI Monitoring uses for every event if no other template is specified.
Follow these steps to define the default template and publishing location:
Expand the Administrator branch and select the “Webcast Locations” branch. Click on the “Add” button to define a new location or on the blue Edit button to select an existing location:
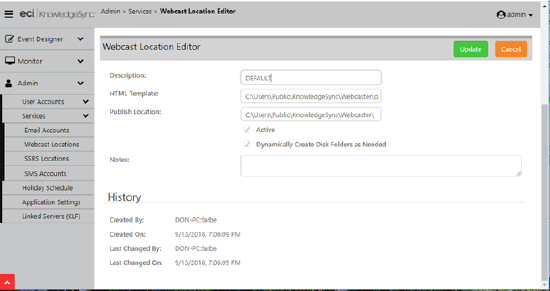
WEBCAST TEMPLATE & PUBLISHING LOCATION DEFINITION
Description: If you are adding your first webcast location, give this location a name of “DEFAULT” (all uppercase). You MUST have one template with a description of DEFAULT.
HTML Template: Specify the name and location of the default template that will be used. Do not reference mapped drives; use UNC specifications instead.
Publish Location: Enter the name of the folder beneath which you have defined the sub-folders in which webcast output will be generated.
For example, if you created publishing locations (folders) beneath the “Webcaster” folder called “General”, “Murphy”, and “Farber”, your selection for the publish location would be:
D:\Program Files\KPI Monitoring\Webcaster\
(Do not use mapped drives and make sure you place a backwards slash at the end of the publishing location. This tells KPI Monitoring to put the dashboard output into the appropriate sub-folders beneath this location.)
Active: This makes the webcast publishing location available for use in KPI Monitoring events.
Dynamically create disk folders: This option lets you specify whether you want KPI Monitoring to create folders in which dashboards are created if those folders do not already exist.
Note that the KPI Monitoring Windows Service must have the required privileges to create folders beneath the publishing location you specified above.
Note the following about publishing locations:
The computer running the KPI Monitoring service must have write capability to the publishing location.
You may specify an FTP/SFTP address as the publishing location using the format:
ftp://username:password@ftp.location...directory_name
You may use a WML file as a template to support WAP access for handheld devices.
Dashboard Subscribers
Dashboard subscribers are most often controlled via the event’s trigger; no other subscriber set-up is required. See the section of this chapter titled “Webcast Trigger Design” for details. Only when a dashboard is used as a “User Alert Listing” are traditional subscribers used. Please see the section of this chapter titled “User Alert Listings” for details.
Webcast Trigger Design
Before you design a trigger for use with a dashboard, you need to decide the following:
Will my event create a single dashboard (e.g., “Customers on Hold”) or multiple dashboards (e.g., “Tim’s Customers on Hold”. “Dave’s Customers on Hold”, etc.)? Your answer to the above question will determine the design of the trigger that is used with your dashboard event.
One Event – One Dashboard
If an event is going to generate a single dashboard, you should hard-code the location and name of that dashboard within the trigger itself.
Take an example of a “Customers on Hold” dashboard that displays a list of all customers on credit hold. You might decide to store this dashboard file in a folder called “General” and you wish to call that output file “customers_onhold”. Here’s how you would design the corresponding trigger/query:
Create a trigger/query that retrieves on hold customers.
Create a trigger/query column whose contents are:
'(name_of_publishing_folder)'+'\'+'(name_of_output_file).htm'
As in:
'General'+'\'+'customers_onhold.htm'
The above column name tells KPI Monitoring to create the dashboard file in the “General” publishing folder, and to give the dashboard output file a name of “customers_onhold”.
Give the above column a customized name of “dashboard_address”.
Preview the trigger/query to make sure that the “dashboard address” field shows up as:
General\customers_onhold.htm
Save your trigger/query.
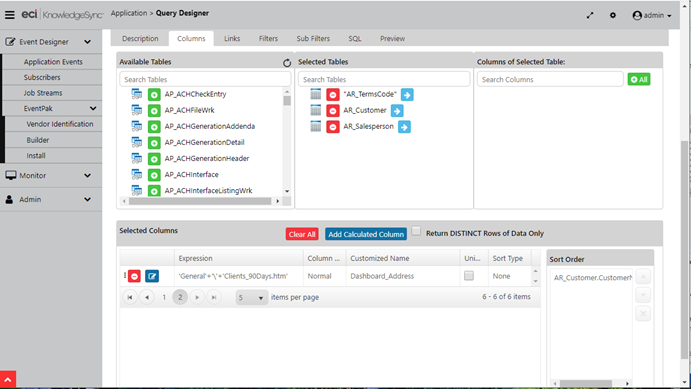
WEBCAST DASHBOARD QUERY WITH HARD-CODED PUBLISHING LOCATION
One Event – Multiple Dashboards
If an event is going to generate multiple dashboards (e.g., user-specific), you will need to embed variables within the trigger/query dashboard address column. Using the example of the “Customers On Hold” dashboard, let’s say you want to create one dashboard for each salesperson who has on-hold customers and you have salesreps named Farber, Smith, and Jones. You’ve already created a publishing location folder for each of them.
Now consider the trigger; each customer is associated with a salesrep (the three mentioned above) and each salesrep’s last name corresponds to a publishing location. So – all you need to do is to tell KPI Monitoring to create a separate dashboard for salesperson who has on-hold customers.
You would create a calculated column, and its format would again be as follows:
'(name_of_publishing_folder)'+'\'+'(name_of_output_file).htm'
But instead of hard-coding the name of the publishing folder (as previously detailed), you would use a database field to control the name of the folder in which the dashboards will be created, as in:
"AR_Salesperson"."lastname"+'\'+'customers_onhold.htm'
"AR_Salesperson"."lastname" is the field that contains the last name of the salesrep to whom a customer is assigned – and that last name also corresponds to the name of the folder in which you want each dashboard to be created. KPI Monitoring will automatically create the appropriate dashboards in the appropriate locations based on the records retrieved by a trigger.
(And so, if 3 salesreps had on-hold customers, KPI Monitoring would create three dashboard output files, one in each of the 3 corresponding publishing location folders, and each file would be called “customers_onhold.htm”.)
Triggers that create multiple dashboards must include a “Sorting” field that groups the matching records by dashboard recipient. Thus, in the above example, the query also includes a sorting field on the salesrep’s last name.
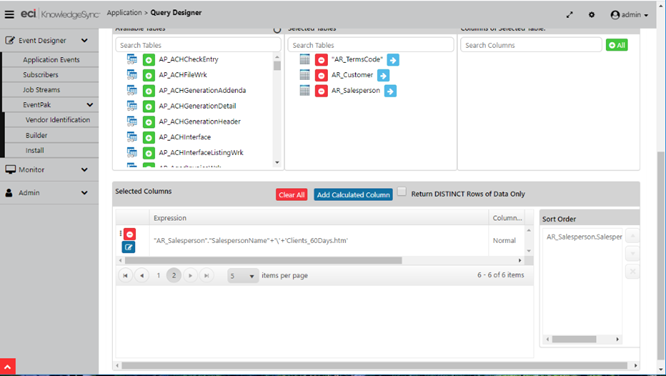
QUERY DESIGN FOR MULTIPLE DASHBOARDS (NOTE SORTING)
Dynamically Naming the Dashboard Output File
In addition to dynamically determining the publishing location of dashboard output files, KPI Monitoring also lets you dynamically name the dashboard output file itself. In the example from the preceding section, 3 salesreps named Farber, Smith, and Jones would each have a dashboard file called “overdue_activities” in their corresponding folder. But what if you wished to precede the name of each dashboard output file with the name of the salesrep?
Easy – just modify the dashboard address column as follows:
(database_field)+'\'+(database_field)+'(name_of_output_file).htm'
As in:
"AR_Salesperson"."lastname"+'\'+"AR_Salesperson"."lastname"+'_customers_onhold.htm'
Now the salesrep named Farber will have a file called “farber_customers_onhold” in his folder, and the other salesreps will have correspondingly-named dashboards as well.
Choosing a Specific Dashboard Template
(You may skip this section if you are using a single dashboard template.)
Earlier in this chapter it was mentioned that you can create multiple dashboard templates. If you have multiple templates, you can control which template the trigger’s resulting dashboard will use by modifying the dashboard address column as follows:
‘(template_location_name):’+’(publishing_folder)’+'\'+'(name_of_output_file).htm'
As in:
dash_ext:General\overdue_activities.htm
This syntax will create a dashboard called “overdue_activities” in the “General” folder using a webcast template called “dash_ext”.
Other Trigger Design Considerations
Consider the elements of data you wish to display within a dashboard. For example:
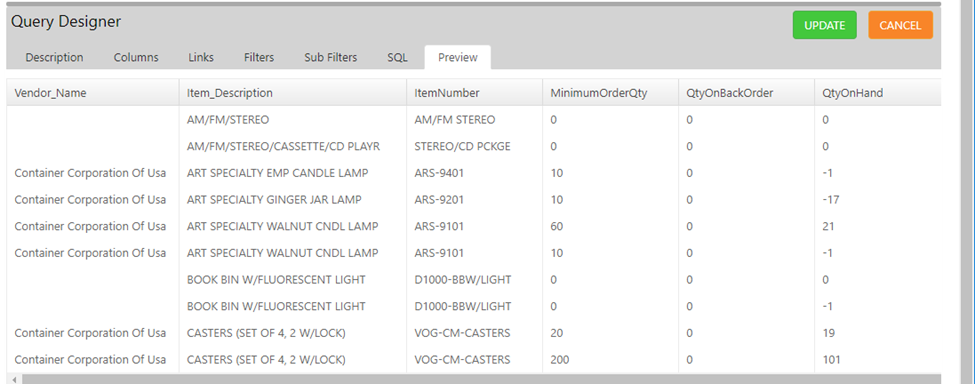
DASHBOARD QUERY WITH MULTIPLE DATA ELEMENTS
Dashboards display their data in this kind of columnar format, and the number of data elements you can include in such a table is limited only by the size of the fields and the display capabilities of your monitor. (You can also adjust the font size of the data in the dashboard template.)
Regardless of how many data elements you wish to display, make sure your trigger/query has selected each of those data elements as “Columns”. Only those columns that are selected for a trigger/query can be later put into a dashboard.
Dashboards can also contain calculated data such as:
Total sales per customer
Average sale amount over the last month
Count of orders per salesperson
A Dashboard That Uses an Aggregate Trigger
If you are creating a dashboard trigger/query that uses an aggregate function – such as the “summarize” or “count” functions, the column that contains the dashboard address must include a database field name (due to SQL syntax restrictions).
The best way to handle this is to choose a one-character field from your database (such as a “status” field) and use the “substring” command to retrieve a value from that field that will always be blank. For example:
SUBSTRING(sysdba.CLIENT.STATUS,20,1)+'General'+'\'+'Opp_Count_Value.htm'
In this example, no data is being retrieved from the “client status” field, but without a field reference, the dashboard address value (by itself) would not be accepted by the query’s SQL syntax.
Configure Dashboard Event
To specify the content of a dashboard, create an event that uses the trigger you designed, and then select the “Webcast” deliverable in the Event Designer. The Webcast deliverable is where you specify the contents of your dashboard. Dashboards are typically formatted to display their data in a table (columnar) manner; since this data will be shown in an HTML format, the webcast message must be defined using HTML syntax.
The webcast subject will typically be a description of the overall event – such as “Overdue Payments”. You can also include data variables in your subject, such as “Overdue Payments for {rep_name} Clients”
A standard webcast message template is provided with the Dashboard Set-Up Kit from KPI Monitoring. We encourage you to use this template.
Click on “Preview Message” to create or customize the webcast content; the standard message content template provided by KPI Monitoring is:
<style type='text/css'>
caption.mytable
{
background-color:99CCFF;
color:black;
border-style:solid;
border-width:1px;
border-color:336699;
text-align:center;
}
table.mytable
{
font-family:Tahoma;
border-collapse:collapse;
font-size:10pt;
background-color:white;
width:100%;
border-style:solid;
border-color:336699;
border-width:1px;
}
th.mytable
{
font-size:8pt;
color:black;
text-align:center;
font-weight:bold;
}
tr.mytable
{
}
td.mytable
{
font-size:8pt;
background-color:white;
color:black;
border-style:solid;
border-width:1px;
border-color:cccccc;
text-align:left;
padding:3px;
}
</style>
<table class='mytable'>
<caption class="mytable">{EVENT_DESCRIPTION_COLOR} as of {EVENT_DATE}</caption>
<thead>
<tr class='mytable'>
<th class='mytable'>Heading 1</th>
<th class='mytable'>Heading 2</th>
<th class='mytable'>Heading 3</th>
<th class='mytable'>Heading 4</th>
</tr>
</thead>
<tbody>
{BEGIN*REPEAT}
<tr class='mytable'>
<td class='mytable'>{Data Field 1}</td>
<td class='mytable'>{Data Field 2}</td>
<td class='mytable'>{Data Field 3}</td>
<td class='mytable'>{Data Field 4}</td>
</tr>
{END*REPEAT}
</tbody>
</table>
The variable {EVENT_DESCRIPTION_COLOR} contains the name of the dashboard event and {EVENT_DATE} contains the date and time the event was last run.
The HTML table within the webcast message uses {BEGIN*REPEAT} and {END*REPEAT} so that all matching records will be displayed within the dashboard that’s created.
Expiration Days
The field called “Expiration Days” controls the number of days that information will remain in the Dashboard. Typically, users do not want dashboard information to remain in the display unless the corresponding business conditions remain in existence.
An “Expiration Days” setting of minus one (-1) (the suggested setting) tells KPI Monitoring that each time the dashboard event runs, its contents will be refreshed with only those records that meet the event’s criteria.
Linking Reports/Charts/Files to a Dashboard
Dashboards may be created to include URL links to reports, charts and files. For example, you might have a dashboard that shows overdue payments and you might wish to include a report or chart that shows corresponding A/R Aging Report details.
To link a report, chart, or file to a dashboard event, follow these steps:
- Create the report, chart or file as needed.
- If a report or chart, define it within KPI Monitoring.
- Open the dashboard event, go to the “Deliverables” and add the corresponding reports/charts/files. Select the output format and fill in any required parameters.
- Go to the “Webcast” deliverable window and place a checkmark in the option boxes titled “Include reports as URL links”, “Include files as URL links” and “Webcast notifications should wait until reports are completed”. (The “report” check boxes apply to both reports and charts.)
- The last step in linking a report, chart, or file to a dashboard is the process of specifying where – in the dashboard – you want the link to the report/chart/file (referred to as the “report reference field”) to appear. The name of the webcast field that provides the link to associated reports/charts/files is “{EVENT_URL}”.
- (Each report, chart, or file associated with an event will appear as a separate URL link in the webcast.)
If you want the dashboard to generate just ONE report (and not one report per triggered record), you should place the KPI Monitoring variable called “{EVENT_URL}” in the webcast’s title (or “caption”), as in:
<caption class="mytable">Overdue Invoices {EVENT_URL}</caption>
If, however, you want the dashboard to generate one report per triggered record, you should place the “{EVENT_URL}” value in the body of the webcast, as in:
<th class='mytable'>Order Conf Doc</th>
<td class='mytable'>{EVENT_URL}</td>
This enables you to have reports and charts that are unique to each record in the webcast display. In the above example, the first line below is an HTML table’s column heading, and the second line is for each table row, and will display the report/chart link that is related to the corresponding triggered record:
“Repeat-Enable” the Dashboard Event
Since you want to make sure that every time a dashboard runs, KPI Monitoring will show all matching records, make sure that the event is repeat-enabled by going to the event details window and checking ON the option to “repeat notifications”.
Dashboard Subscribers
Except for user alert listings (detailed later in this chapter), dashboard events do NOT use “Standard Subscribers”. This is because the trigger/query that powers a dashboard event already contains the location and name of the dashboard output files; all you need to do is to specify the name of the trigger/query field that contains the dashboard location and name information.
(In the example from earlier in this chapter, the field where this was stored was called “dashboard_address”.)
Thus, you would do the following to select the dashboard subscriber:
- Click on the “Advanced Subscribers” option from within your dashboard event.
- Click in the last field in the lower grid (“Contains webcasting name”) and a list button will appear.
- Click on this button and choose the field called “dashboard_address”.
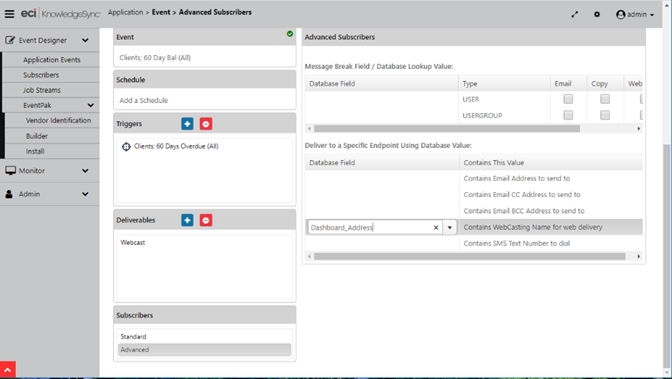
WEBCAST ADVANCED SUBSCRIBER SELECTION
Schedule the Event
Like any other event, go to the “Schedule” tab to specify how often a dashboard event runs. Note that the frequency of running will determine how often this event updates its display with new or changed data.
Run a Dashboard Event
To run a Dashboard event once – right now – follow these steps:
- Click on the desired dashboard event to highlight it.
- Click on the button called “Run Now”.
- Once the event has been submitted, go to the Monitor module to track its status. Begin in the “Application Events” branch to see that the event has gone from “Checked” to “Triggered” (assuming that the event’s conditions have been met.)
- Once triggered, you can click on the blue plus sign (“Details”) next to an event and then view its tracked items and deliverables. You can then go to the “Webcast Delivery” tab and look at the “Pending”, “Sent Today”, or “Errors” tabs to see the status of the generation of your dashboard.
A Portal for Reports & Charts
A second use for dashboards is as a “portal” where generated charts and/or reports can be published and then easily accessed by users.
Portals can be created per user, per department, or even company-wide.
A sample template for the Reports Portal shown below is available from KPI Monitoring; please contact our technical support department if you would like to receive it.
When using webcasting for reports and charts, be sure to check ON the webcast window options for “including reports as URL Links.” A simple reports & charts portal can look like the following:
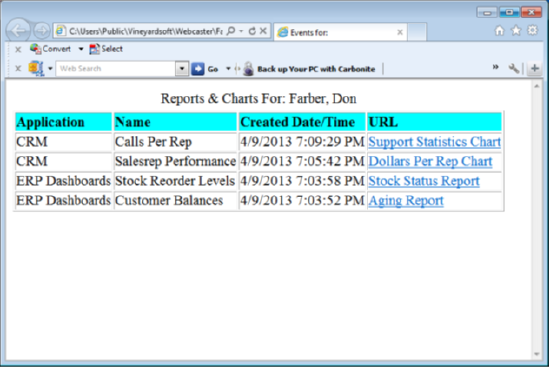
SAMPLE REPORTS & CHARTS PORTAL
User Alert Listings
An additional use for dashboards is as a display of all of the alerts sent to a user.
In this configuration, a user would typically have a single dashboard window which would list all of the alerts from the events that the user wishes to be informed about. Because such a window could contain a wide variety of event data, the design of such a window is typically very generic. A sample template (called “KS_Webcaster.html”) is included in the “webcaster” folder beneath the KPI Monitoring installation folder. Typically, this same template would be used for any users who wish to have access to this display of their own triggered alerts.
Like all Dashboards, User Alert Listings are self-updating so newly-triggered events will automatically be added to the displays. User Alert Listings are also an excellent way to deliver Forms, Documents, and Reports to the users viewing these listings.
User Alert Listings typically look like the following:
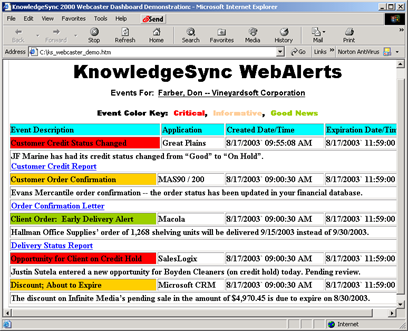
SAMPLE USER ALERT LISTING
Subscribers to User Alert Listings
- Once you have created your webcast publishing locations, you can define the address for each subscriber who will receive a user alert listing dashboard.
- Go to the KPI Monitoring “Subscribers” option, locate the subscriber whose address for their user alert listing you wish to define. Go to the “Webcast” tab for the selected subscriber.
- In the “Name” field, type the name of the webcast folder in which the alert listing will be created. (Do not entire the entire path; just the publishing folder name.)
- In the “Location” field, click on the drop-down arrow and select the dashboard template to be used when displaying this subscriber’s alerts. You may define both a primary and secondary webcast delivery details for a subscriber.
- If you will be using webcasting but not for user alert listings, it is suggested that you select the “DEFAULT” publishing location.
Webcast subscriber details looks like the following:
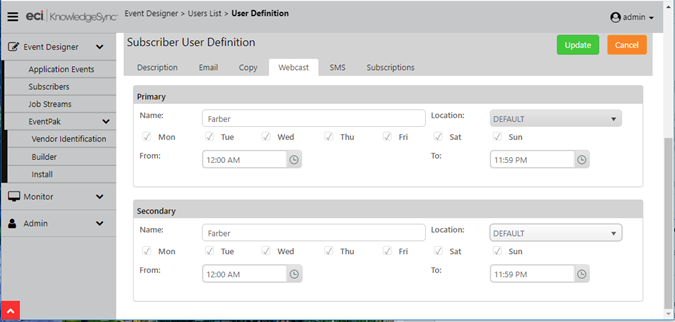
SUBSCRIBER WEBCAST ADDRESS DEFINITION
For any event whose webcast details you with to populate into a subscriber’s User Alert Listing, go to the “Subscribers > Standard” window of the corresponding event, select the subscribers whom you wish to generate the User Alert Listings for, and place a checkmark in their “Webcast” delivery option.
How User Alert Listings are Populated
When an event that updates a User Alert Listings is triggered, KPI Monitoring automatically creates or updates the corresponding dashboard file and publishes it to the corresponding location of each subscriber.
When additional events are triggered, KPI Monitoring automatically re-creates the user alert list dashboard file, including both the existing alerts and the details of any newly triggered events. (Existing alerts will continue to be listed on a subscriber's alert listing dashboard until the alert's “expiration date” has arrived.)
One of the most powerful aspects of user alert listings is that unlike email, a subscriber may keep a web browser open to their specific alert listing location and receive real-time updates about newly-triggered events.