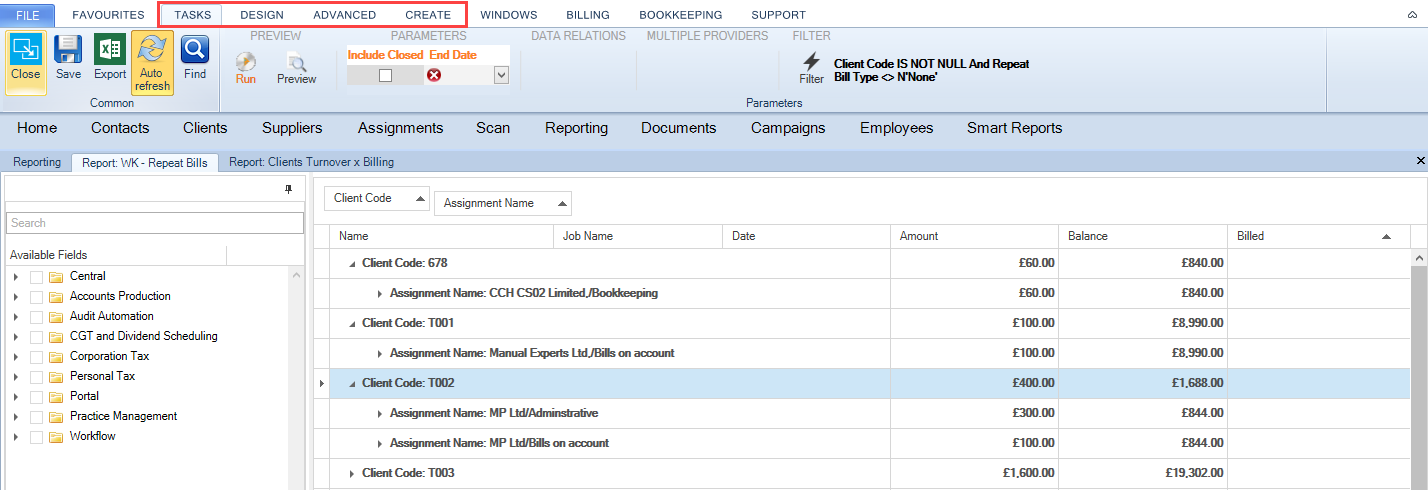
Report Layouts

Grid Layout
When editing a grid report, the output is displayed in a standard grid layout.
The main menu presents different options Tasks, Design, Advanced, Create to assist the user to build up different layouts.
Calculated Columns
It is possible to insert a calculated column into a grid report.
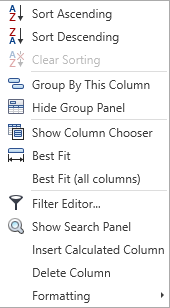
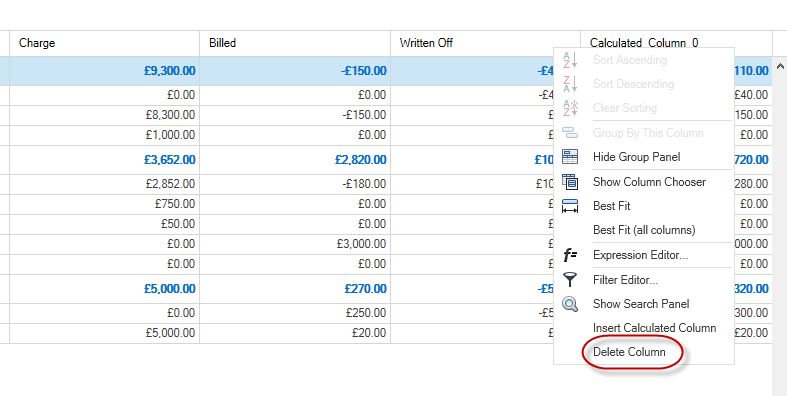
Right-click on the heading and select Insert Calculated Column.
The Insert Calculated Column option uses the Expression Editor. (See Expression Editor for more information)
To delete an Inserted Calculated Column, right click on the customised column heading and select Delete Column.
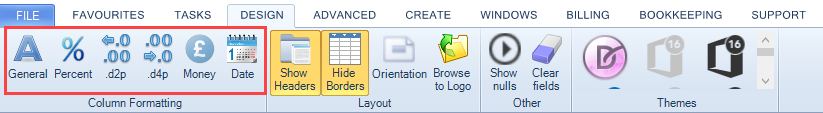
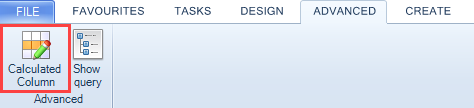
It is also possible to format a column and insert a calculated column from within the main menus Design and Advanced by simply highlight the column on the report and click on the options as below:
Design menu:
Advanced menu:
Formatting
It is possible to change the column format into a report.
Right click on the heading and select Formatting.
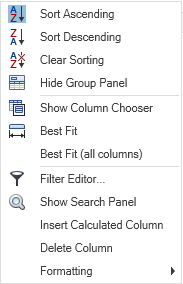
The following options are available:
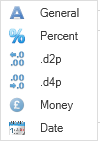
|
General |
This displays the cell value in a no specific format. |
|
Percent |
This multiplies the cell value by 100 and displays the result with a percent symbol (%). |
|
.2dp |
This displays the cell value with two decimals. |
|
.4dp |
This displays the cell value with four decimals. |
|
Money |
This attaches to the cell value the currency symbol (£). |
|
Date |
This displays the cell value as date. |
Note: this option can be used for both grid and pivot report.
Pivot Tables
When editing a pivot table, the output is displayed as a pivot table.
Multiple years
It is possible to view your data in a cross tabular format, e.g. for each of the last 3 years. To achieve this, the report must contain a field with an associated date range, e.g. Tax Year, Accounting Period, Accounting Year etc.
From the Ribbon amend the Parameters Start and End Dates accordingly. Click Run to refresh the report.
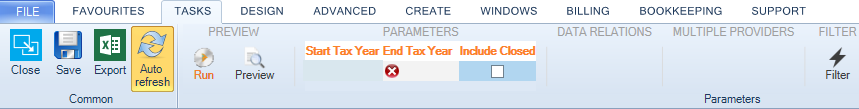
If the Parameters panel is not present, a date driven field may be missing from the report. Or alternatively the filter can be used.
Variance Column + % Variance Column
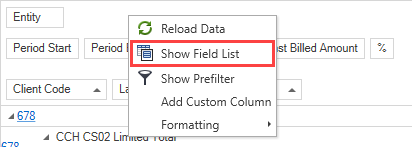
It is possible to insert either a variance or % Variance column into the Pivot Table. Right click “Data Headers” and select Show Field List.
Note: The Data Headers description is only returned where four or more fields are used within the ‘data’ area on the Pivot Table. Where three or less fields are used, the actual field names are returned.
The PivotGrid Field List appears.
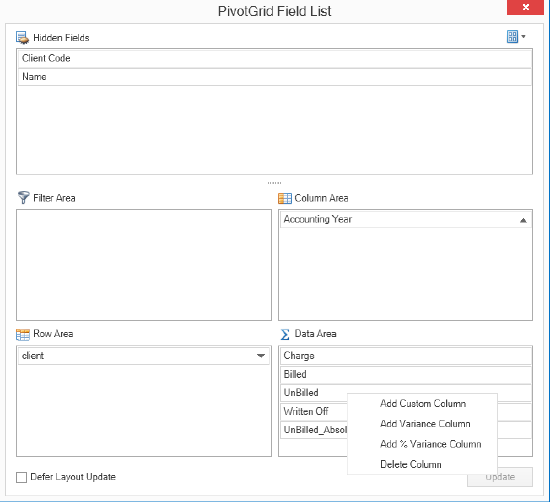
In the Data Area, right click the column to apply the variance and select either Add Variance Column or Add % Variance Column.
Click the  to close the form, the Variance Column now appears within the report.
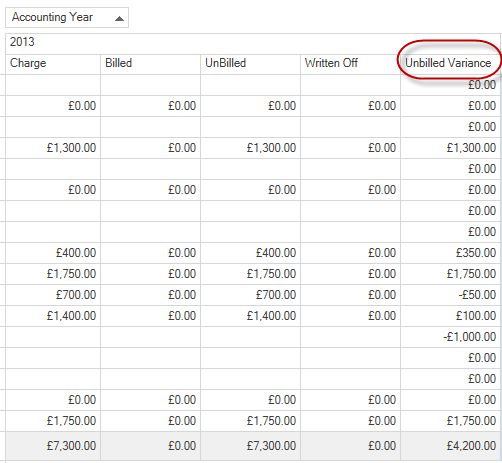
Note: To ensure that the Variance Column appears within the report; the Pivot Table must span multiple years.
Renaming the Data Columns
Where three or less fields are used within the Data area, double click on the field Name, rename and remove focus by tabbing or clicking elsewhere.
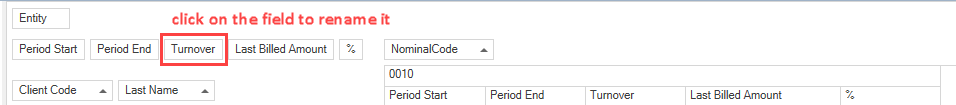
To rename a column used within the Data area of a Pivot Table where four of more fields are used, hover over Data Headers, the fields are displayed.
Position the mouse over the field to rename until the cursor changes to a line (similar to I). Rename and remove focus by tabbing or clicking elsewhere.
Deleting the Data Columns
It is possible to delete an inserted column from the Pivot Table using Show Field List.
On where the column/data headers are displayed, right click and select Show Field List.

The PivotGrid Field List window opens.
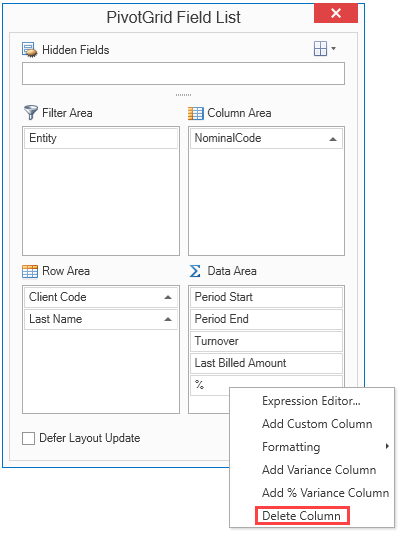
In the Data Area, right click on the relevant column name, select Delete Column.
Click the  to close the form, the inserted column has been removed.
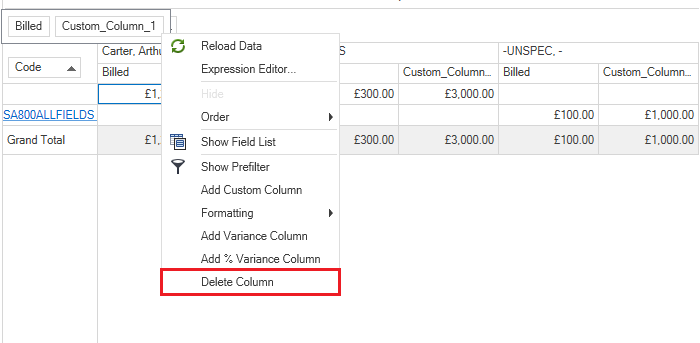
Delete Column
Position the mouse over the field until the cursor changes to a hand  . Right-click and select Delete Column option.
Hiding Columns
It is possible to hide fields within the Pivot Table. E.g. you may have added an additional column for the purposes of adding two existing columns together using the expression editor. Once the additional column is present, there may not be any reason to display the original two columns (but they are required to remain for calculation purposes): Right click Data Headers and select Show Field List.

If the fields are present within either of the Filter, Column or Row Areas, drag the fields into the Hidden Fields box. Where the fields are present within the Data Area, first drag the fields to the Filter area and then onto the Hidden Fields box.
Click the  to close the form, the relevant columns are now hidden from the report.