CCH KPI Monitoring : Administration

KPI Monitoring Administration
The KPI Monitoring Administration Module lets you:
- Specify who has access to KPI Monitoring and what functions they can perform (this includes the designation of multiple 'tenants' in a multi-tenant environment)
- Configure settings for sending alerts via email, web dashboard (webcast) and text (SMS)
- Designate the location(s) for reporting via SQL Server Reporting Services (SSRS)
- Specify Integration details for connecting KS to Synergy (If you are using the Exact ‘Synergy’ product)
- Specify your organization’s holidays (which let you control whether individual events will run on holidays)
- Set application settings for such items as inactivity time and the location of log files.
- Create one or more SQL Server 'linked servers' – used to connect to database types that have some limitations in terms of data analysis and retrieval
The Administrator: Logging in
Administrator: Logging In
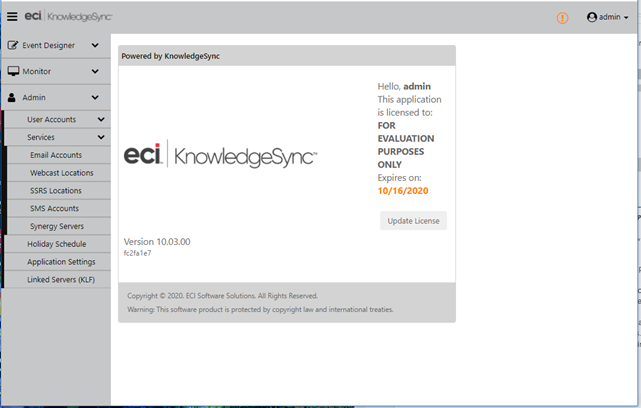
Once you have logged into KPI Monitoring, expand the 'Admin' branch and you’ll see a window like the following:
KPI Monitoring Admin Options (on left)
User Accounts: Roles & Users
Expand the 'User accounts' option and you’ll see options for 'Roles' and 'Users'. It’s important to understand the difference between these in KPI Monitoring:
Roles: This controls what KPI Monitoring functions a person can access – such as creating events, viewing events, creating users, et cetera.
Users: This controls what KPI Monitoring data a person can access – for example, user ‘A’ might have access to KPI Monitoring events for application #1, whereas user ‘B’ might have access to KPI Monitoring events for application #2.
Each KPI Monitoring user is assigned a specific role – and that role controls what KS options and functions that user can access within that person’s allowed data sets.
You can copy and paste both role and user records using the 'Copy' and 'Paste' buttons that appear at the top of each option.
Multi-Tenancy Access Rights
In a multi-tenancy environment, where a single KPI Monitoring installation is being used by multiple customers, there will typically be a single overall KPI Monitoring System Administrator who can grant access rights for all tenants. This 'KS Admin' will typically create individual customer-specific KS administrators, such as 'KS Tenant #1 Administrator', 'KS Tenant #2 Administrator' and so on. The KS System Administrator is responsible for specifying what data sets each tenant administrator has access to, as well as what system options each tenant administrator can access.
It then becomes the responsibility of the individual KS Tenant Administrators to create the user profiles for their respective users – controlling what KPI Monitoring functions each of their users can access.
Roles
(KPI Monitoring comes with a “Global Admin” role which is a super-user role that has all entitlements enabled. If you choose to setup multiple access levels in your organization, please create new roles and users. You cannot modify or delete the Global Admin role.)
KPI Monitoring “roles” control what application functions a KPI Monitoring user can perform. For each KPI Monitoring “user”, you’re able to assign them a specific “role” which controls the KS system functions that they can access.
KS comes with a couple pre-configured roles, and you may use (& customize) them as well as create an unlimited number of additional roles of your own. To create a role, follow these steps:
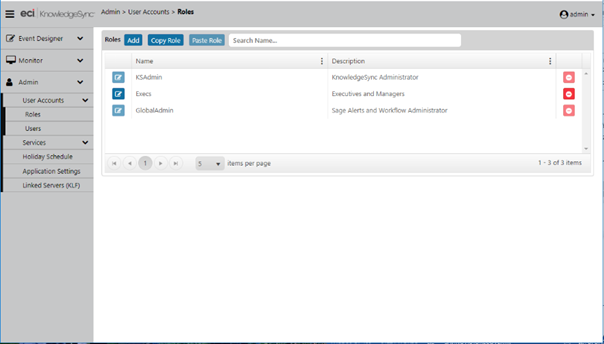
Under “Admin”, expand “User Accounts” and then click on “Roles”. You’ll see a window like the following:
KPI Monitoring 'Roles'
Click on the “Add” button to add a role and you’ll see the following window:
Add/Edit a 'Role'
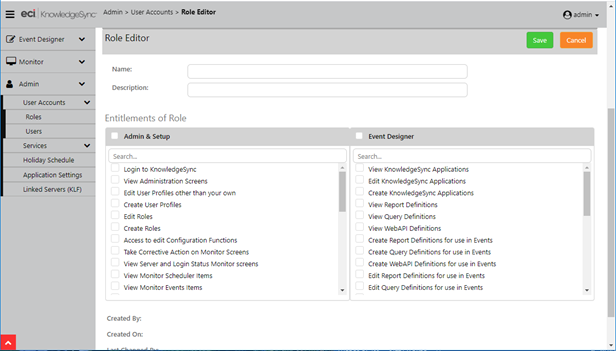
Roles consist of the KPI Monitoring administrative and event design functions that can be performed. Administrative actions are divided into the following abilities:
- Log into KPI Monitoring
- View KS Admin options
- Create and edit both roles and users
- Access KS configuration settings
- Access to various parts of the KS Monitor (including “corrective actions” on any KS events that have errored (such as fixing an invalid email address for an alert)
- Update KS version 10-specific settings
Event design functions are divided into the following abilities:
- View, edit & create KPI Monitoring applications, queries, events, reports, schedules, subscribers, and web APIs
- Build and install EventPaks
Put a checkmark next to each Admin or Event Design option that you would like to enable a specific “role” to be able to perform or put a checkmark next to the headings of “Admin & Setup” or “Event Designer” if you would like to enable a role to perform all of the options below that heading.
Click on “Save” to retain your entries.
Users
(KPI Monitoring comes with a default “Admin” user which you cannot modify or delete except for the Admin password.)
The “Users” option lets you specify what data elements (applications, events, queries, et cetera) each person who logs into KPI Monitoring will be able to access. To create a user, follow these steps:
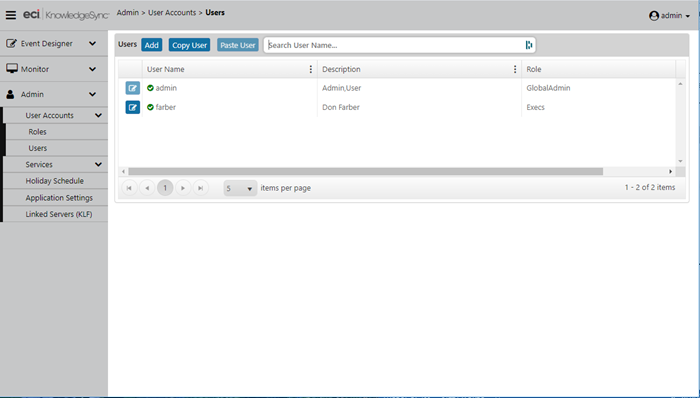
Under “Admin”, expand “User Accounts” and then click on “Users”. You’ll see a window like the following:
KPI Monitoring 'Users'
Click on the “Add” button to add a new user and you’ll see the following window:
KPI Monitoring New 'User'
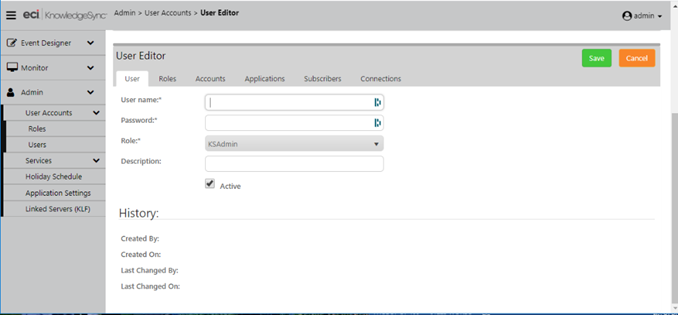
In addition to a username and password, each user is assigned to a specific “role”, as detailed in the preceding section. Begin on the “User” tab to specify the person’s login name, password, selected role, and description – such as their full name. Note that you can control whether a user is “active” – and thus can access the selected data elements.
Users: Roles
The “Roles” tab within the “Users” option controls the roles that this user is able to assign to others as well as the roles that this user is able to administer.
Users: Account Access
The “Accounts” tab controls which accounts (if any) a user can utilize in the configuration of KS events that use email, webcast, and SMS for the sending of alert messages, and that use SSRS for the generation of reports. This includes:
- Which email account(s) the user can select from
- Which webcast locations the user can select from
- Which SSRS reporting servers the user can select from
- Which SMS account(s) the user can select from.
Note:KPI Monitoring uses Twilio as its SMS Provider and users will need to purchase a Twilio subscription to send text-based alerts. Just two fields from Twilio (account SID and auth key) will need to be entered into KPI Monitoring
If you wish to allow a user to select from all email, webcast, texting locations, and SSRS servers, click in the checkbox next to “All Current and Future Accounts”.
Users: Appplication Access
This tab shows a list of all the applications (e.g., ERP, CRM, HR) that are currently configured to be monitored by KPI Monitoring. If you wish to allow a user access to all applications, click in the checkbox next to “All Applications”. Otherwise, place a checkmark next to only those applications whose data and events you wish the current user to be able to access. This is particularly important in multi-tenant implementations, as this allows you to ensure that each KPI Monitoring tenant has access to only those events created for their organization.
Note: Control over which components within an application a user may access or modify depends on that user's “role”.
Users: Subscribers
This tab shows a list of all the alert recipients (“subscribers”) that are currently available to be maintained as well as selected (within an event) to receive alerts from KPI Monitoring. Note the following:
Subscribers may be individual people, groups of people, and “computers” – locations to which reports and files may be FTP’d.
The subscribers referred to here are “standard” subscribers, i.e., people or groups who may be selected from a list. An event may also deliver alerts to “advanced” subscribers; these are people who are associated with the triggered condition (such as “the customer” or “the salesperson assigned to that customer”.
If you wish to allow a user to configure as well as select (within events) all subscribers, click in the checkbox next to “All Subscribers”. Otherwise, place a checkmark next to only those subscribers whose data and events you wish the current user to be able to access.
Users: Connections
This tab shows a list of all the “connection” records (.NET data providers and ODBC and OLE/DB data sources currently configured within KPI Monitoring). If you wish to allow a user access to all of the “connection” records, click in the checkbox next to “All Connections”. Otherwise, place a checkmark next to only those connections whose configurations you wish the current user to be able to access and modify.
Services
The Services option lets you specify the following:
- The email accounts that KPI Monitoring will send alerts from.
- The webcast (web dashboard) locations to which the dashboards will be published (as well as the templates for the dashboards’ appearance).
- The location of your SQL Server Reporting Services (SSRS) (if you will be using KPI Monitoring to generate and deliver SSRS reports).
- The SMS text messaging provider, account and authentication details for sending text message alerts.
(The location of your Exact Synergy application - if you are integrating KS with Synergy). - The holidays for your organization (so you can control whether KPI Monitoring events will be run on a holiday).
- General KS application settings, such as for diagnostic logs and file backups.
Whether you are using Linked Servers, which employs SQL Linked Servers to access data from database with limitations on data analysis and retrieval.
Email Accounts
The option for Email Accounts lets you define one or more accounts from which KPI Monitoring will send email alerts. Multiple email accounts allow you to tailor the “send from” address, such as from different companies or different departments within the same company.
Email Account Creation
The following quick creation set-up steps will suffice for most organizations; please follow these steps and if you are not able to successfully test your email account upon completion, please follow the more detailed steps under “Account Creation”.
If you are using a web-based email account, it may need to be configured to "allow access for less secure applications." This is done to allow KPI Monitoring or other applications the ability relay mail through the email provider.
- Go to KPI Monitoring Admin > Services > Email Accounts.
- Click the Add button located at the top left of the window. The Email Account Editor module opens.
- Click the appropriate Email Type: SMTP or OAUTH2.
SMTP Email Type
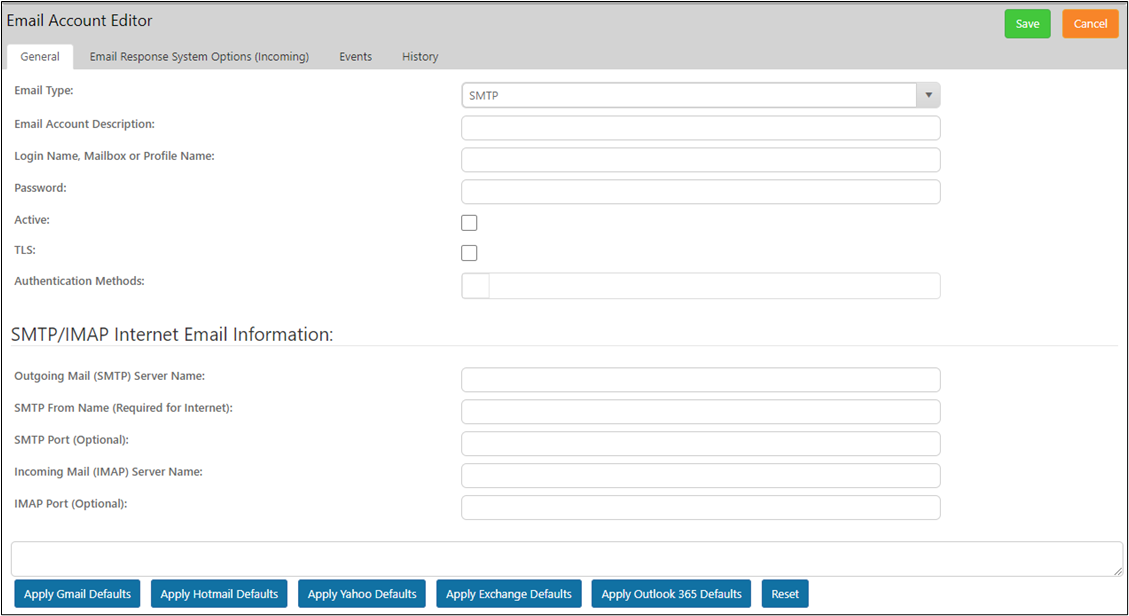
At the bottom of the module, select which email defaults to apply:
- Gmail
- Hotmail
- Yahoo
- Exchange
- Outlook 365
- In the Email Account Description field, you may change the text BEFORE the first slash to reflect a description of the account, but it is critically important not to delete or change the remainder of the information.
- In the Login Name, Mailbox or Profile Name field, enter your user ID. This ID is the full email address account name, for example: MyAccount@gmail.com.
- In the Password field, enter the password for the email account.
- Ensure the Active box is checked.
TLS and Authentication Methods:
For the TLS (Transport Layer Security) and Authentication methods, do not change the defaults.
In the SMTP/IMAP Internet Email Information section, enter in the following information:
- Outgoing Mail (SMTP) Server Name
- SMTP From Name (Required for Internet)
- SMTP Port (Optional)
- Incoming Mail (IMAP) Server Name
- IMAP Port (Optional)
Click Save.
0AUTH2 Email Type
Please note, if using OAUTH2 email type, the on-prem installation relies on a service in the cloud to connect to Microsoft. Users should use the Advanced Email Configuration for OAUTH2 for the client credentials workflow.
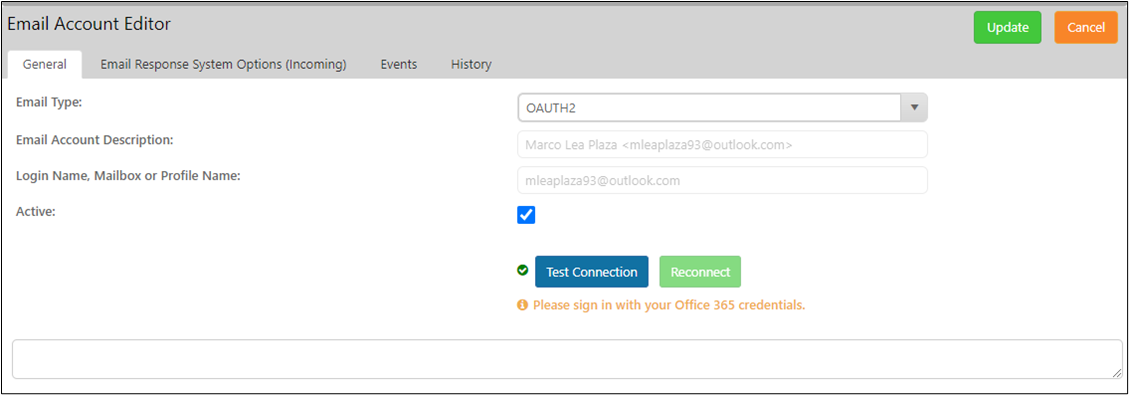
- Select the Email Type. Choose SMTP or OAuth2 from the dropdown menu.
- In the Email Account Description field, you may change the text BEFORE the first slash to reflect a description of the account, but it is critically important not to delete or change the remainder of the information.
- In the Login Name, Mailbox or Profile Name field, enter your user ID. This ID is the full email address account name, for example: MyAccount@gmail.com.
- Ensure the Active Box is checked.
Click the Test Connection button. If a green checkmark is visible, the connection is valid. Click the Reconnect button if the green checkmark is not visible.
Testing Email Accounts
- Click on the Description area of the email account you just created so the line becomes highlighted.
- Click the Perform Email Test button.
- Enter the desired recipient email address and click OK.
- Check the recipient email account to see if the test message has sent successfully.
Note: You may need to check the Monitor or Corrective Action area of Administrator if the send is not completing. You may also want to try re-starting the KPI Monitoring service if items are not sending but also not displaying an error in the Monitor.
Email Response System Options (Incoming)
This option refers to the ability for KPI Monitoring to monitor and respond to the content of incoming email messages, such as messages that are sent to an organization’s generic email accounts – e.g., info@KPI Monitoring.com, support@KPI Monitoring.com, et cetera.
The configuration and use of the Email Response System (ERS) is covered in a separate chapter of this manual – please refer to that chapter for details.
Events tab
On this tab, all events are listed with their associated applications. A green check mark indicates the events is active.
To update a sender account for an event, check the box in the Is Sender? column and then click the Update button to set the current email account as the sender on all events.
Note: If the current email is already the sender account on an event, the checked box for the Is Sender? column is disabled. This prevents removing the sender account from the application. Only users with permissions to edit or create events or to create an events email alert can make changes to the event definition tab.
History tab
Lists the following information about the email account:
- Created By
- Created On
- Last Changed By
- Last Changed On
Webcast ( Dashboard Alert) Locations
This option refers to the ability for KPI Monitoring to send alerts to dynamically published and updated web (HTML) pages. (E.g., a person in accounting might want a dynamic web page that shows all invoices due this week, while someone in shipping might want a dynamic web page that shows a list of all orders due to ship today.)
Please refer to the chapter titled “Dashboard Alerts (Webcasting)” for complete details on the configuration and use of this module.
SRRS Locations
KPI Monitoring triggers, generates, and delivers reports – either on a “scheduled” basis (e.g., an hourly stock status report), or on a “triggered” basis (e.g., an A/R report that’s generated only when a client exceeds their credit limit.). You may use either Crystal Reports or MS SQL Server Reporting Services (SSRS) with KPI Monitoring to generate and deliver your reports.
For SSRS reports only, you need to specify some initial configuration details. Expand the “Admin” module and under “Services”, click on “SSRS Locations.” When you add or update an SSRS location, the following window will appear:
SQL Server Reporting Services ( SRRS) Setup
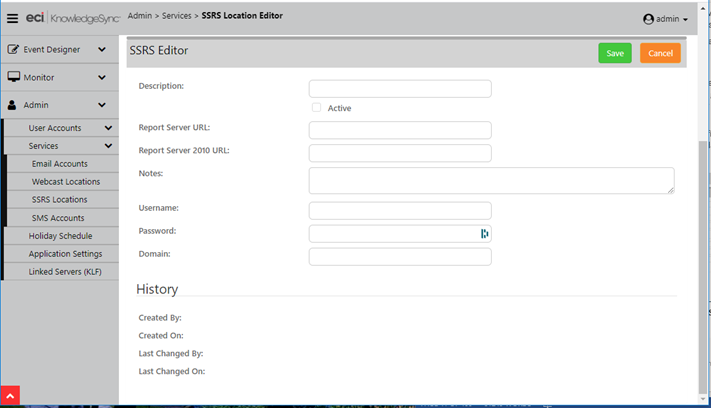
Fill in the fields as follows:
Description: The name of the SSRS server (e.g., “SSRS on QA-SVR123”)
Active: Whether this SSRS configuration will be available to KS events.
Report Server URL: This is the URL of the SSRS Report Execution 2005 Service on the report server (e.g., “http://qa-svr123/ReportServer”). Copy this URL from SQL Server Reporting Services Configuration Manager. Make sure the URL is accessible from the machine where KPI Monitoring (the web application and Windows Service) is running. Use a “localhost” URL only if KPI Monitoring and SSRS are installed and running on the same machine.
Report Server 2010 URL: This is the URL of the Report Service 2010 Service on the report server.
Notes: Use this field to contain comments about the corresponding SSRS location.
Username/Password/Domain: This is where you specify the credentials used to run the Report Execution service of SSRS. The values in these fields must match the settings in the SQL Server Reporting Services Configuration Manager.
Note: The domain can be entered separately (in the “Domain” field) or it may be included in the username, as in “mgmt\svcQASQL”.
SMS Accounts and Twilio Integration
One of the ways that KPI Monitoring can send alerts is via text messaging to a mobile phone, generally referred to as SMS or “short message service”.
KPI Monitoring uses Twilio as its SMS Provider and users will need to purchase a Twilio subscription to send text-based alerts. You will need to enter two fields (account SID and auth token) from Twilio into KPI Monitoring.
Twilio offers many service options. You will need “Programmable SMS” for sending texts using KPI Monitoring.
To configure KPI Monitoring to send SMS alerts, open the Administrator, expand the “Services” option, and select “SMS Accounts”. Click on “Add” to create a new SMS account and the following window will appear:
SMS (Alerts via text Message) Setup
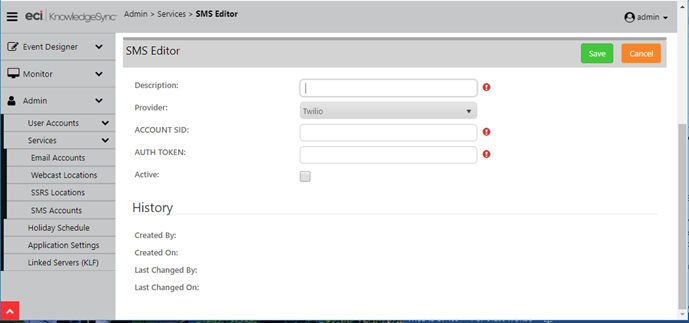
Fill in the fields as follows:
Description: The name of the SMS service (e.g., “KS Texts”)
Provider: Select your choice of testing provider (currently, “Twilio”).
Account SID: (you receive this from the texting provider)
Authorization Token: (you receive this from the texting provider)
Active: Click in this box to enable this SMS account for use in sending alerts via text message.
Click on the “Save” (or “Update”) button to retain your entries.
Exact Synergy Integration
Exact Synergy is a request and task management application that is frequently used in combination with KPI Monitoring. Typically, Synergy integration with KS is used so that when KS detects an important business condition, it can trigger the creation of a request/task within the Synergy application. It’s also worth noting that KPI Monitoring can monitor the Synergy application for critical, time-sensitive conditions and can trigger corresponding alerts and workflow.
To configure KPI Monitoring’s integration with Synergy, open the Administrator, expand the “Services” option, and select “Synergy Servers”. Click on “Add” to create the integration and the following window will appear:
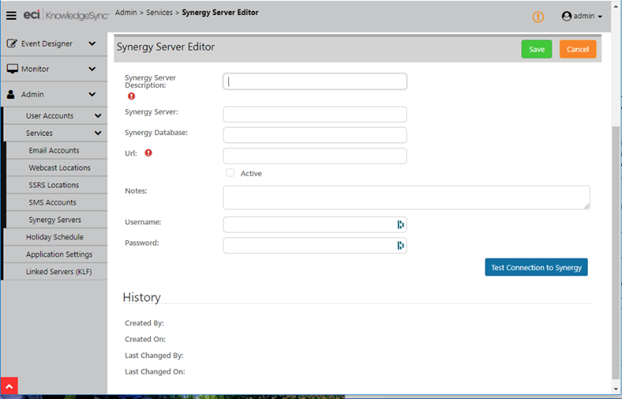
Fill in the fields as follows:
- Server Description: The name of the Synergy server being connected to KS
- Server: The location of the Synergy server . . .
- Database: The location of the Synergy database . . .
- URL: The URL address of the Synergy . . .
- Notes: Details about this Synergy server
- Username: The user account used to log into the Synergy server
- Password: The password for the account specified previously
Click on the “Save” (or “Update”) button to retain your entries. Be sure to confirm a successful connection to your Synergy server by using the button called “Test Connection to Synergy”.
Holiday Schedule
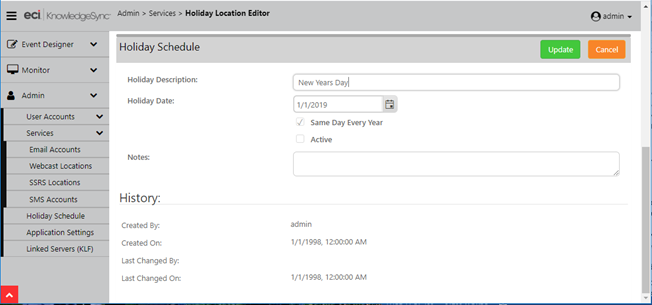
You can control whether a KPI Monitoring event will run if it falls on a holiday. To define your holidays (and review pre-configured holidays), expand the Admin module, and then click on “Holiday Schedule”. You may either add a new holiday or review and edit existing holidays.
To edit the configuration of an existing holiday, click on the blue “Edit” button next to the desired holiday in your window.
For each holiday, you have access to the following data:
Holiday description (e.g., “Christmas Day”)
Holiday date (you can select from the calendar icon)
Whether the holiday falls on the same date every year (e.g., Christmas always falls on December 25th)
Whether the holiday is currently active, thus enabling an event to be configured to observe that holiday and not be submitted on that date.
Each event may be configured to either run or not run on a holiday.
Holiday Definition
Applicvation Settings
KPI Monitoring has several system settings that help you customize the application to your specific needs and enable & disable diagnostic settings in case you need more details on the execution of events (such as for debugging an event that is failing). You can use the “Application Settings” option under the “Admin” menu option or click on the “gear” icon in the top-right of the KPI Monitoring window.
There are 4 types of system settings:
Portal: These control inactivity, log file and backup settings for the web portal.
Engine: These are additional log and backup settings, as well as the location of email alert attachments and the location of KPI Monitoring files.
Engine Modules: These control the diagnostic “level” (degree of detail) settings for the individual KPI Monitoring servers. Note this is also where you can specify the maximum “retries” for when KPI Monitoring is unable to send alerts via email, SMS, and webcast alerts.
Automated Cleanup: These control the automated removal of historical files from the KPI Monitoring system.
Error Log Reporting
Most of the options within KPI Monitoring can have “error reporting” turned on for enhanced details regarding any errors that KPI Monitoring is experiencing during event processing. The error logging level for the KPI Monitoring Portal is set in the “Portal” option within Application Settings; all other logging levels are set within the “Engine Modules” option.
Both the KS Portal and KS Service write text-based file logs on the server that can be used for troubleshooting any issues that might occur.
Number of Log Files to Retain
The number of backup log files retained is determined by the setting “Maximum Number of Backup Log Files to Keep” (in both the “Portal” and “Engine” tabs). Set this value to ‘1001’ to retain all log files.
Log File 'Rolling Style'
In both the Portal and Engine tabs, there is a setting for the “Log Based on Rolling Style” The “rolling style” determines how and when new log files are created.
Once – Each module has a single log file which will grow as data is added to it. The logs will be backed-up and replaced by a new file only when the KPI Monitoring Windows Service is stopped or when the KPI Monitoring web application in IIS is stopped and restarted. Older log files will have names such as KSService.1.log, KSService.2.log, et cetera.
Size – Each module creates a log file that is backed-up and replaced by a new file when the current log reaches the size configured in “Log File Maximum Size”. Older log files will have names such as KSService.1.log, KSService.2.log, et cetera.
Date – Log files are backed-up and replaced every day. The format of the log file name is determined based on the
settings of the “Log Date Pattern” and the “Log File Path” (see following sections). As an example, a portal log file from 10/1/2020 would have the name PubKSPortal-20201001.log
Composite – This is a combination of Size and Date styles described previously. A new log file is created when the size limit is reached or the date changes.
Log File 'Date Pattern'
The “Log Date Pattern” (set in both the Portal and Engine tabs) is the format of the date (for the file name) when used in the naming of log files.
Log File Paths and Names
KPI Monitoring uses the following settings to determine the locations and names of its log files:
Portal: See the setting “Portal Log File Path”. The default name and location is:
C:\ProgramData\KPI Monitoring\KSLogs\PortalLogs\PubKSPortal.log
Engine: See the setting “Service Log File Path”. The default name and location is:
C:\ProgramData\KPI Monitoring\KSLogs\ServiceLogs\KSService.log
Log File Names for the Engine Modules
Within the “Engine” tab is a setting called “Individual Log Files for Engine Modules”.
This setting determines whether the Engine modules listed below will write a single log file for all the engine modules (set to ‘No’), or will write separate log files for each engine module (set to ‘Yes’).
If the “Individual Log Files for Engine Modules” setting is enabled, the following log files are created for the engine modules:
- KSService-Action.log
- KSService-ApplicationEvents.log
- KSService-Copy.log
- KSService-Email.log
- KSService-ERS.log
- KSService-Report.log
- KSService-Scheduler.log
- KSService-SMS.log
- KSService-Webcast.log
Logging Levels
Set the logging levels as follows:
- ERROR: Only exceptions and errors that occur in the application will be logged. This is the default (and minimum) level of error reporting.
- WARN: Errors and warnings are logged.
- INFO: Informational messages are written to the error logs, in addition to errors and warnings. These include such items as parameters passed into a query or report.
- DEBUG: This is the most detailed level of log reporting. Debug level diagnostics are written in addition to INFO, ERROR and WARN messages. These include query results, email message texts, and other detailed data.
In general, we recommend setting the log level to ERROR or WARN during normal processing.
To modify any of these settings, simply click in the corresponding “Value” field and type in your selection. Those settings which have pre-defined values to choose from (such as a log level of “info”, “warn”, “error”, and “debug”) and will show a list button when you click in the “Value” field.
Engine Modules: 'Maximum Attempts'
If KPI Monitoring attempts to run an event and an error occurs, KPI Monitoring will attempt to “re-try” running the specific event component that failed. The number of times KPI Monitoring will attempt to re-try the failed process is referred to as “maximum attempts”. You can set the number of maximum attempts for the following event components in the “Engine Modules” tab:
- “Events”: Event triggers
- “Email”: Sending an email alert
- “SMS”: Sending a text (SMS) alert
- “Webcast”: Sending a webcast alerts
- “Reports”: Generating an event’s reports and/or charts
- “Actions”: Executing an event’s “actions”
The “Maximum Attempts for . . . “setting specifies how many times an operation is retried before the item is moved to the “Error” category in the KS monitor.
Note: that the “Error” display options in the monitor each have a “Retry” button – and clicking on this button will reset the number of “maximum attempts” to zero for the item, and thus allow the module to attempt to process the item again.
File Paths for KS EventPaks, Reports, Scripts and Other Objects
In addition to log file paths, several other KPI Monitoring file paths can be updated through Application Settings:
In the “Portal” Tab:
- Epak File Path: Where Eventpak files are built on the server before being downloaded to the client machine.
- Reports File Path: Where generated reports (Crystal & SSRS) are saved on the server.
- Scripts Path: Where Visual Basic script files are stored on the server.
In the “Engine” tab:
- Attachments Path: Where an event’s file attachments are generated / stored on the server before they are attached to emails or webcasts.
- Email Response Attachments Path: If KS is configured to monitor incoming email messages, this location is where received email attachments are saved on the server.
- Service Installed Path: This an information value only; it Indicates the path on the server where the KS Service is installed.
Automated Cleanup
The “Automated Cleanup” tab (within application settings) is used to schedule a job that removes the history of “completed” events from KPI Monitoring. The options are:
Scheduled Time: The time of day (in AM/PM format) when this job runs. The default is 1:03 AM.
Keep Records for (Days): The number of days of completed event history data to be retained in the KS database.
Schedule This Task: Whether the automated cleanup job is active. Un-checking this option means that the cleanup job will not run.
Please note that there is no option to do an ad-hoc submission of the automated cleanup job. However, “Schedule This Task” setting can be temporarily checked on to enable a single run of the job, after which the setting can be unchecked.
Linked Servers
Note: If you are integrating KPI Monitoring with a Sage 100 Providex database environment, please use the stand-alone KPI Monitoring Linking Function (KLF) that is located on the “Downloads” page of the Sage Alerts & Workflow website instead of the “Linked Servers” option. The KLF program and documentation are located on the downloads page.
KPI Monitoring can monitor information in a database via .NET database Provider, OLE/DB, ODBC, and REST API web service.
For some non-SQL databases, you’ll find it best to create a “link” between the target database and SQL Server. This is called a “linked server” and it optimizes retrieval and analysis for non-SQL databases that do not have a strong native database driver. A linked server has the following benefits:
- It reduces the amount of time to retrieve data.
- It enables calculations not supported by the database’s native driver.
- It creates single-field unique “keys” for each database table.
The process of using a linked server for a database is as follows:
- You create a 64-bit ODBC source that points at your target database.
- You use KPI Monitoring to create a linked Microsoft SQL Server database.
- You connect KPI Monitoring to the linked database using the SQL database Provider.
Create a Linked Server
After you have created a 64-bit ODBC source that points at your target database, the next step is to create the Linked Server using the ODBC connection you created. Note that the linked server and database get created on the same SQL Server where KPI Monitoring’s database tables reside.
- From the KS “Admin” option, select “Linked Servers”
- Click on the “Add” button.
- Enter a name for the linked database.
- Select the ODBC source that points at your target database. Note that the list button for this field does not display the available 64-bit sources; you must manually type in the name of the 64-bit source.
- Click on the “Create Linked Server” button.
- Once you receive the message that the linked server has been created, click on the “Tables” tab within the Linked Server option. You’ll see a list of all the tables in the target database.
Although you can select specific tables for the linked server, we recommend checking the box titled “Link Checked Tables” to select ALL tables.
If your target database has multiple “entities” (e.g., companies), go to the field titled “Create an optional change tracking column” and type in the entity/company code of your first entity. (You’ll need to create one linked server per entity.)
Click on the “Link” button at the top of this window. Any tables that are not able to be linked will be detailed in the box at the bottom of the Linked Servers option.
Note: The linking process may take some time to complete (e.g., 10 minutes or more) depending on the size of your target database.
The KPI Monitoring Online KnowledgeBase
If you have questions about an aspect of KPI Monitoring, it is suggested as a first step that you scan the on-line knowledgebase of frequently asked questions (and answers). You can access the knowledgebase from:
https://www.vineyardsoft.com/support_knowledgebase.php
If you are receiving an error number or error message, try searching on either of those values; otherwise, keep your search subject as brief as possible to allow for the greatest possibility of a matching answer.
Contacting KPI Monitoring Technical Support
If you are unable to find a solution to your issue via the knowledgebase, the best way to access KPI Monitoring Technical Support is by filling out the “Log a Ticket” form from the following URL: