Creating Custom Reports

Tailor-made reports give Practice employees the opportunity to create bespoke reports that, for example, are not covered by a classic report.
1. To create a new report, from the menu bar select Classic reports then Custom Reports

2. Click on Create new template

3. Click on Save template
4. Give the report a relevant title – in this example “Profit and loss - showing variances”

5. Click OK
To hide this report from your client,
6. Click on the Classic Reports Icon on the left menu and select Custom Reports
7. Click on the relevant report for example Profit and Loss - showing variances

7. Switch off Visible to client users on the right menu

Display Settings
Display settings allow you to control the level of detail displayed on the report
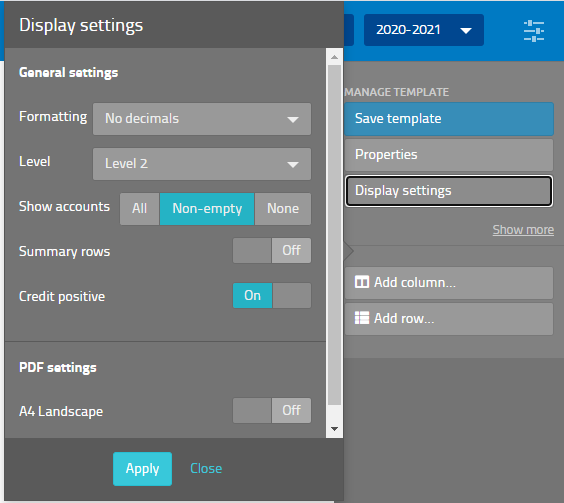
Formatting – choose from show decimals, no decimals and shorten thousands
Levels – allows you to choose between a very detailed (at ledger account level) or very summarised level (P&L this might be one line for expenses)
Show accounts – All, Non-empty, None
Summary rows – On or Off – enables the display of subtotals
Credit positive – On or Off – by default credit values are shown as negative numbers and debits are shown as positives. This setting enables you to toggle to show credits as positives and debits as negatives. However, if this setting is set to off, you can control the display of numbers at a row level.
PDF Settings, A4 Landscape – On or Off
You can choose from a variety of columns and rows.
Columns:

Row:
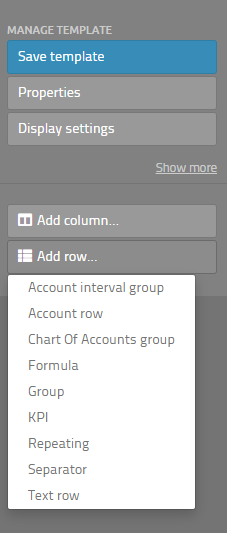
For each row and column, you select, there are settings, shown in the right menu when you select the row/column. For example, you can select a period column and choose which period to display. If the budget is included, you can also control whether it is visible or not. If you want a report that shows multiple periods, you can easily add several period columns, for example, to compare between different periods or projects. Save the report before leaving the page so that your changes are not lost.