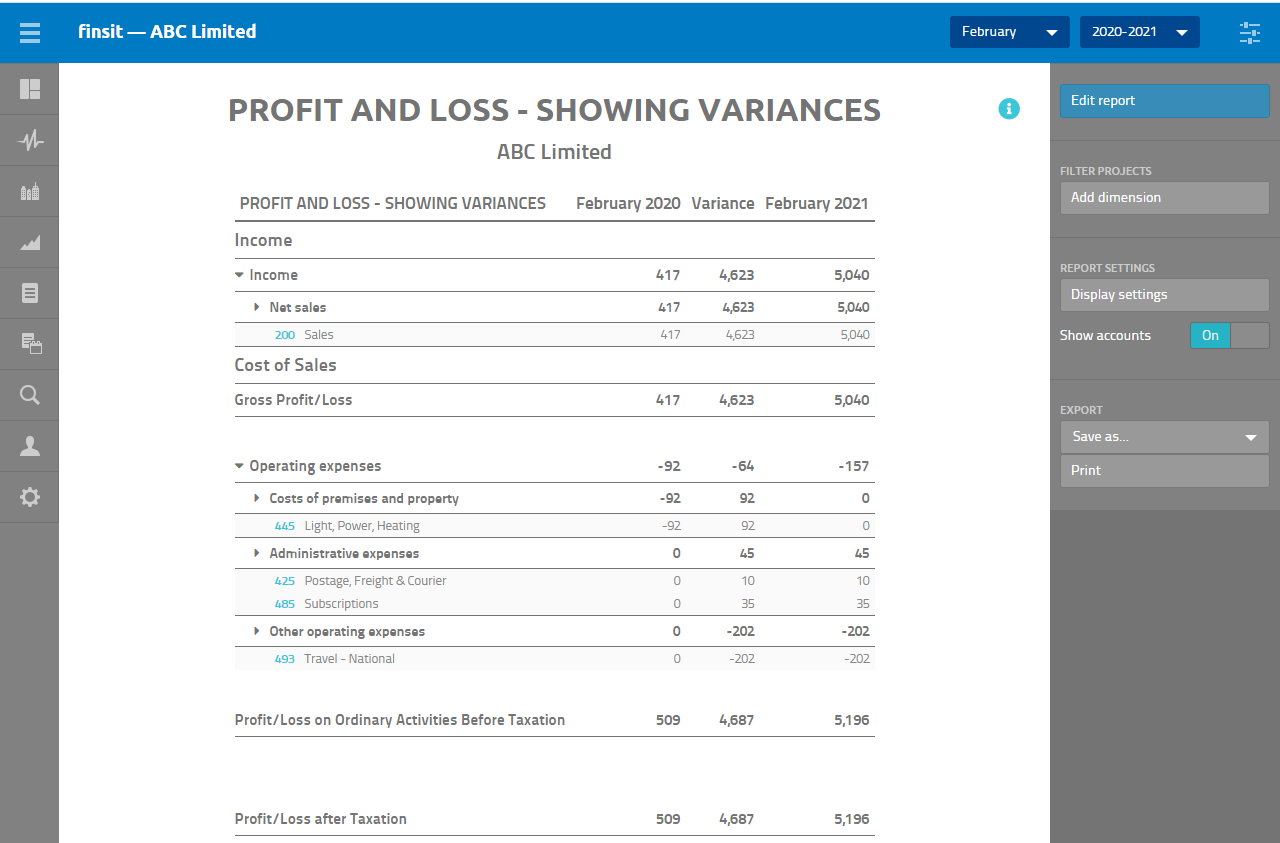
Example 1 - Creating a Profit and Loss Feb 20/21 showing Variances

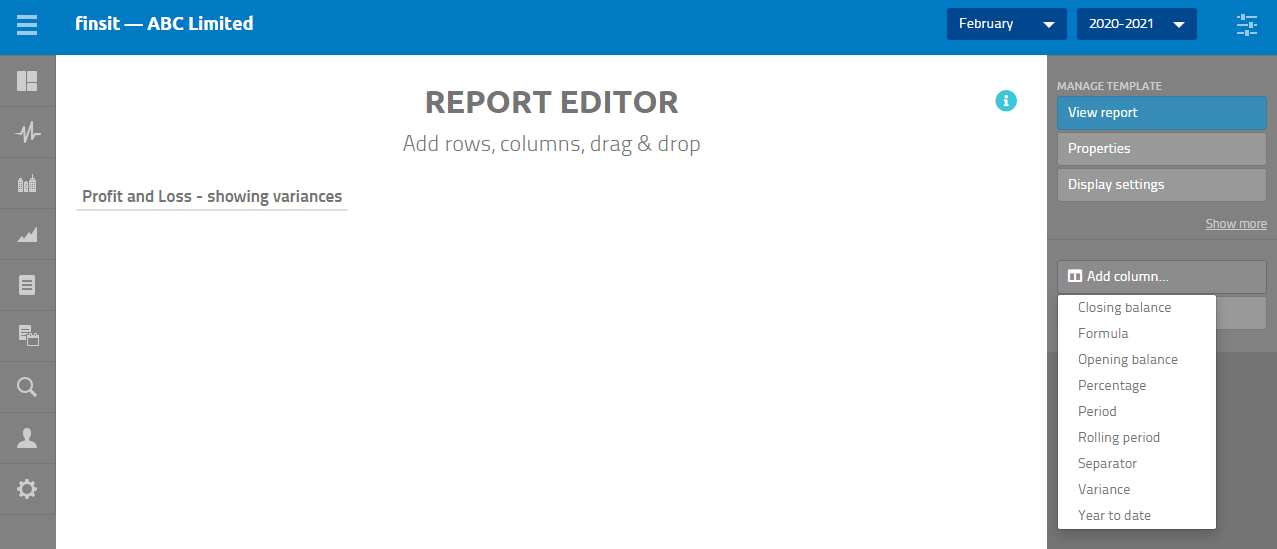
1. Click on Add column and select period
2. Click on Add column and select period again (as shown in the screenshot below)
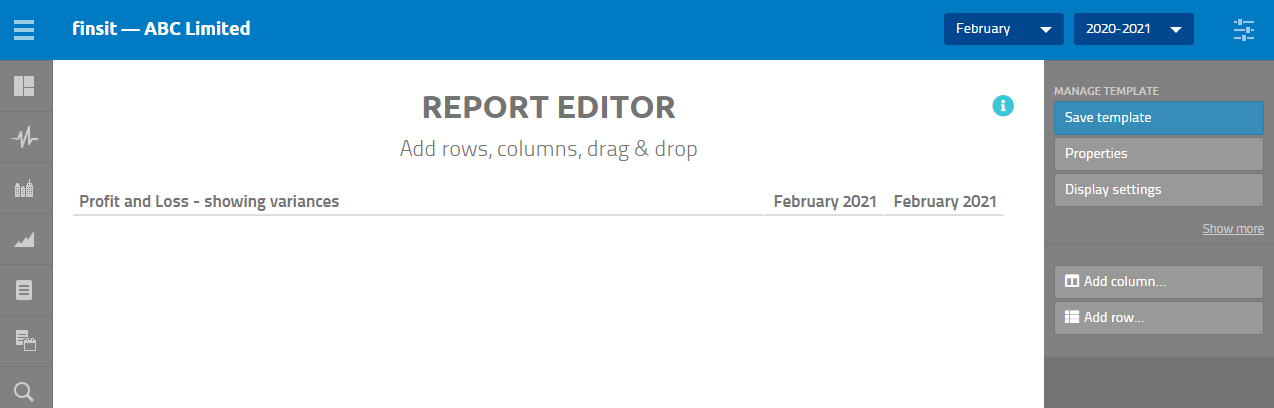
3. Select the first-period column - February 2020
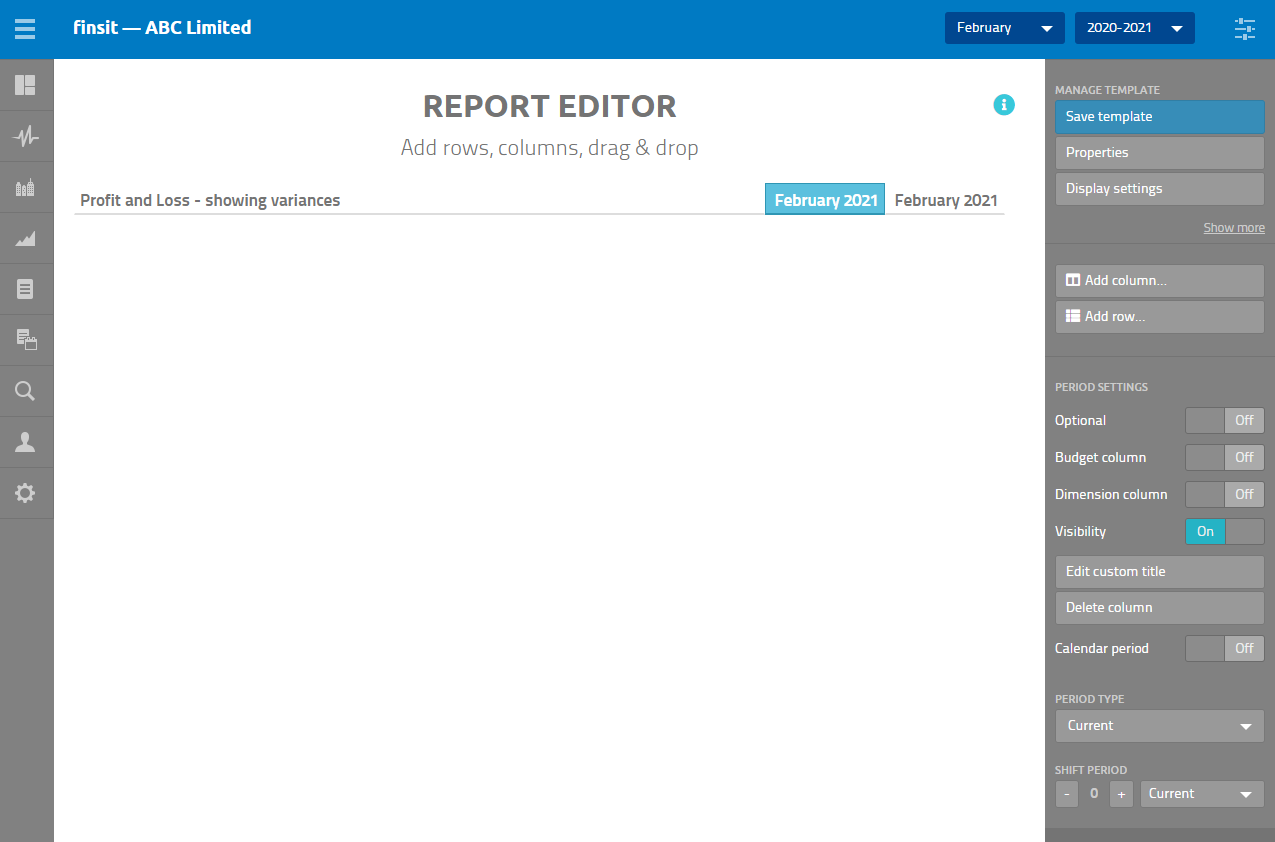
4. Under SHIFT PERIOD click on the minus button to go back 12 months
5. Click on Add column and select Variance

6. Click on Deviation within the REPORT EDITOR
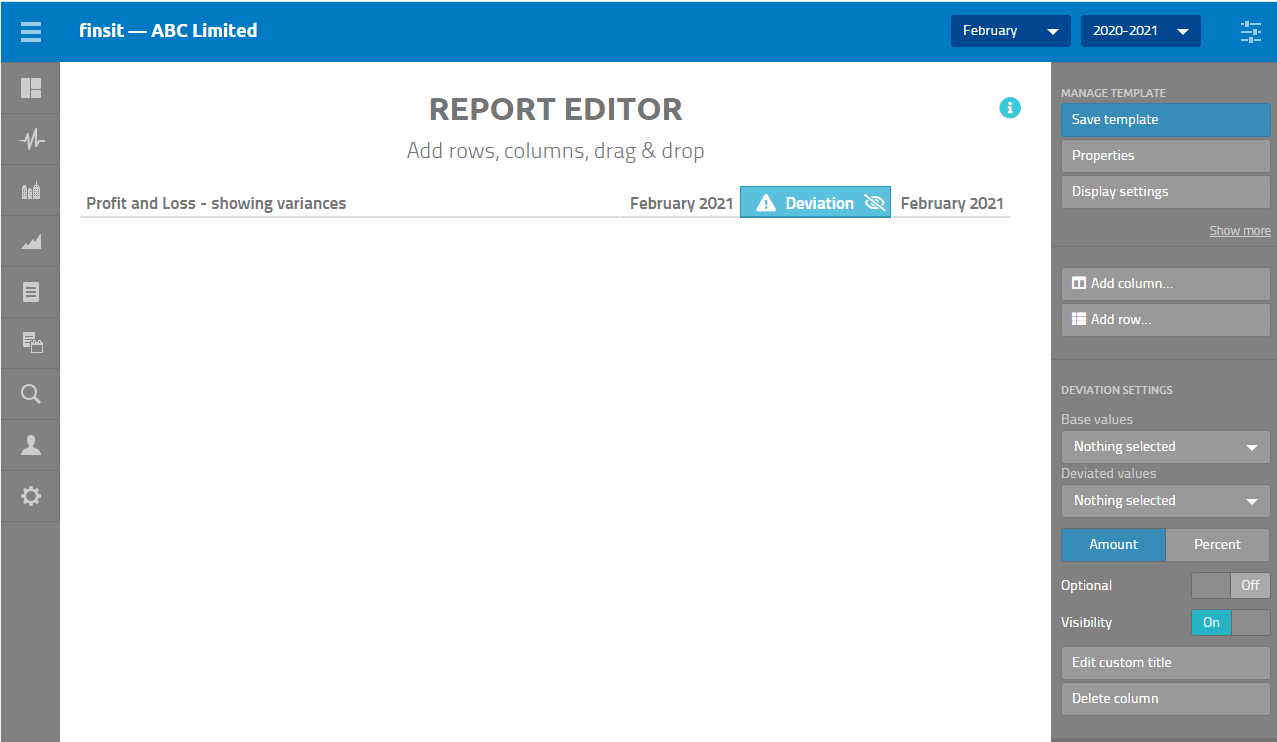
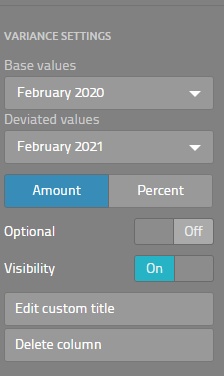
7. On the Right menu below VARIANCE SETTINGS Base values click on the down arrow and select February 2020
8. For the Variance values select February 2021
9. To edit the title, click on Edit custom title
10. Type in Variance
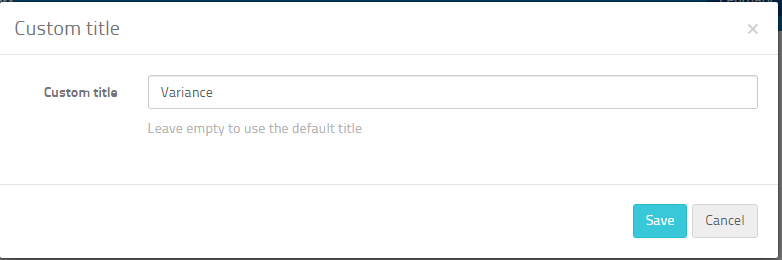
11. Click on Save
Adding a Text row for Income
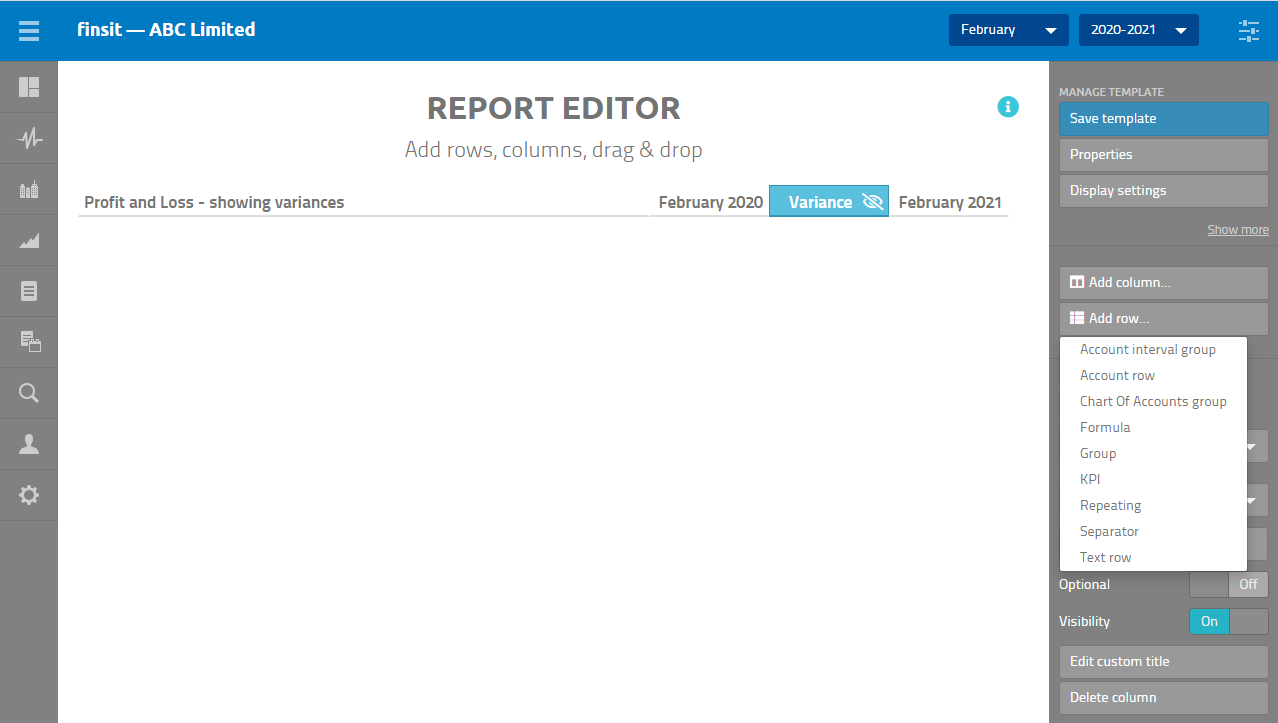
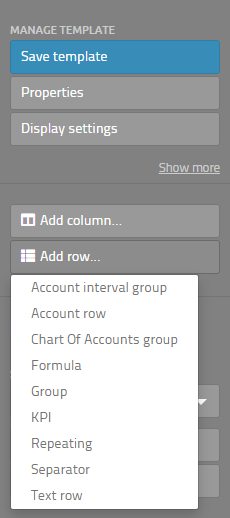
12. Click on Add row and select Text row
13. Type in “Income”
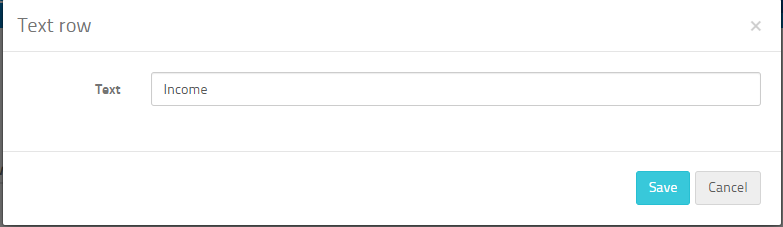
14. Click on Save
15. Click on Add row and select chart of accounts group
16. Select Income
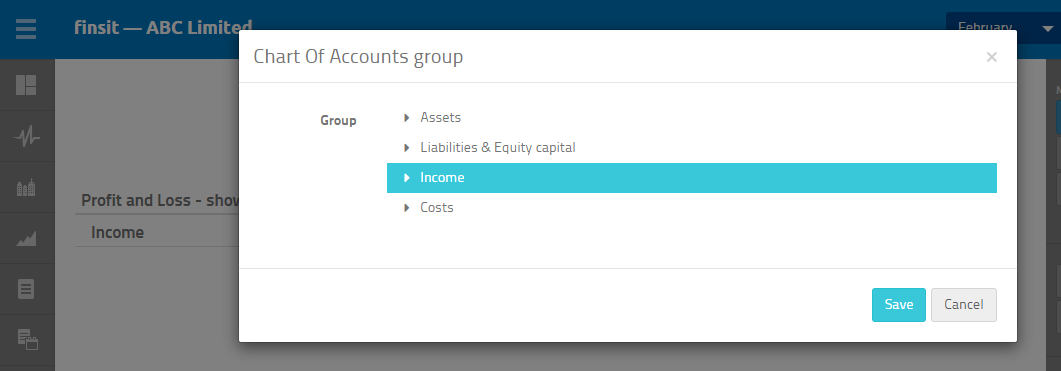
17. Click on Save
Adding a Text Row for the Cost of Sales
18. Click on Add row and select Text Row
19. Type in “Cost of Sales” in the Text field
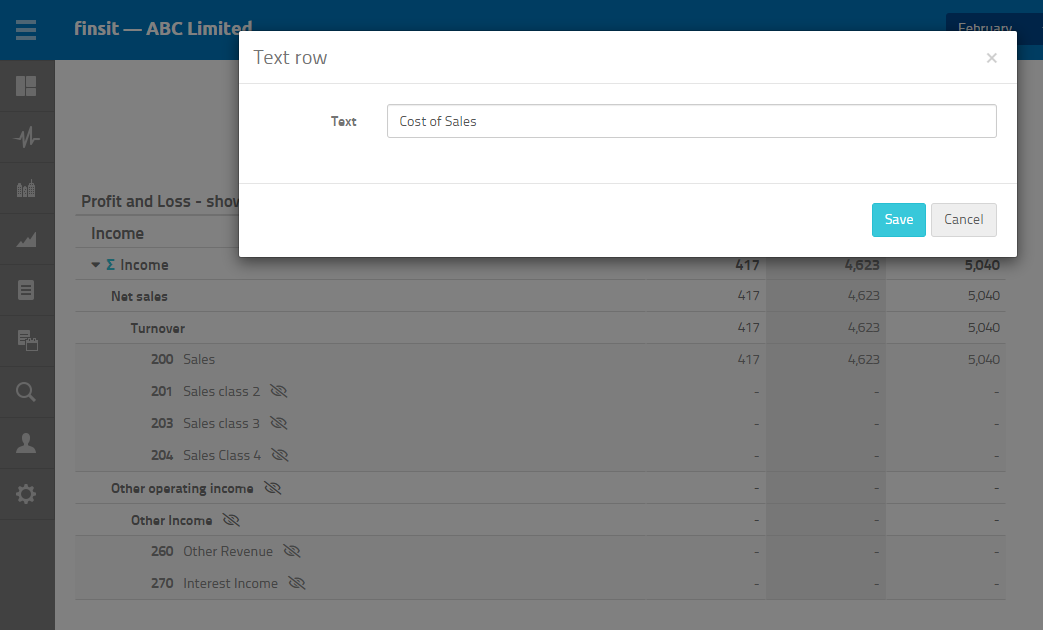
20. Click on Save
21. Click on Add row and select the chart of accounts group – click on Costs and then Cost of Sales
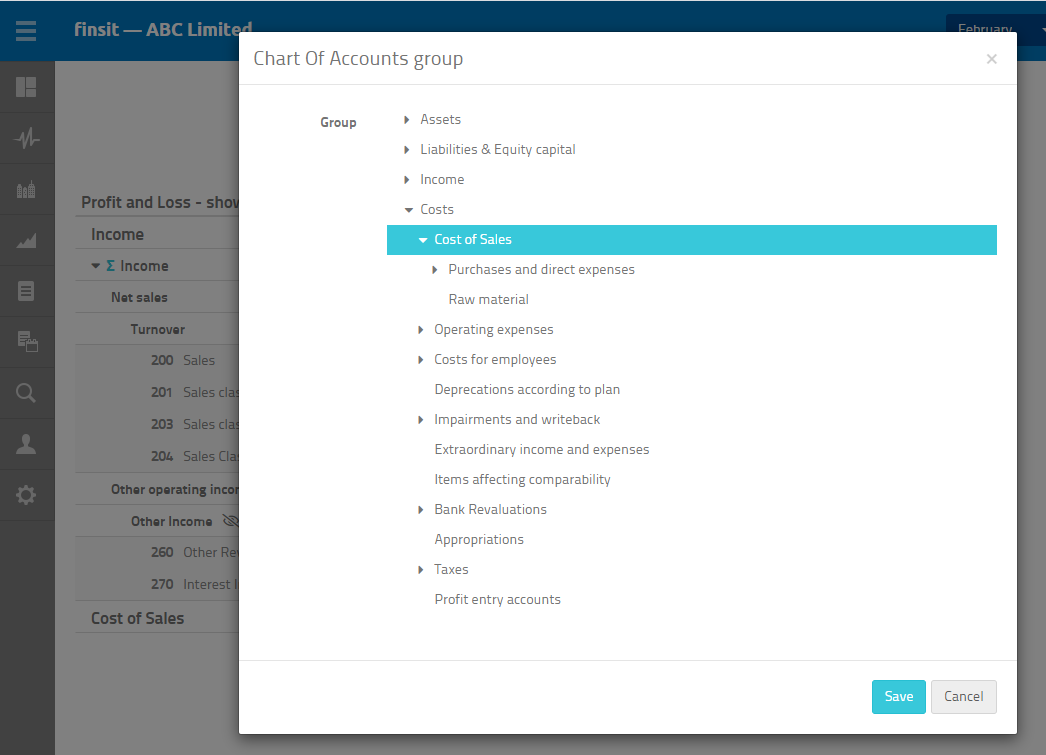
22. Click on Save
Adding a subtotal for the Gross Profit/Loss
23. Click on Add row and select Formula
24. Type in “Gross Profit/Loss”
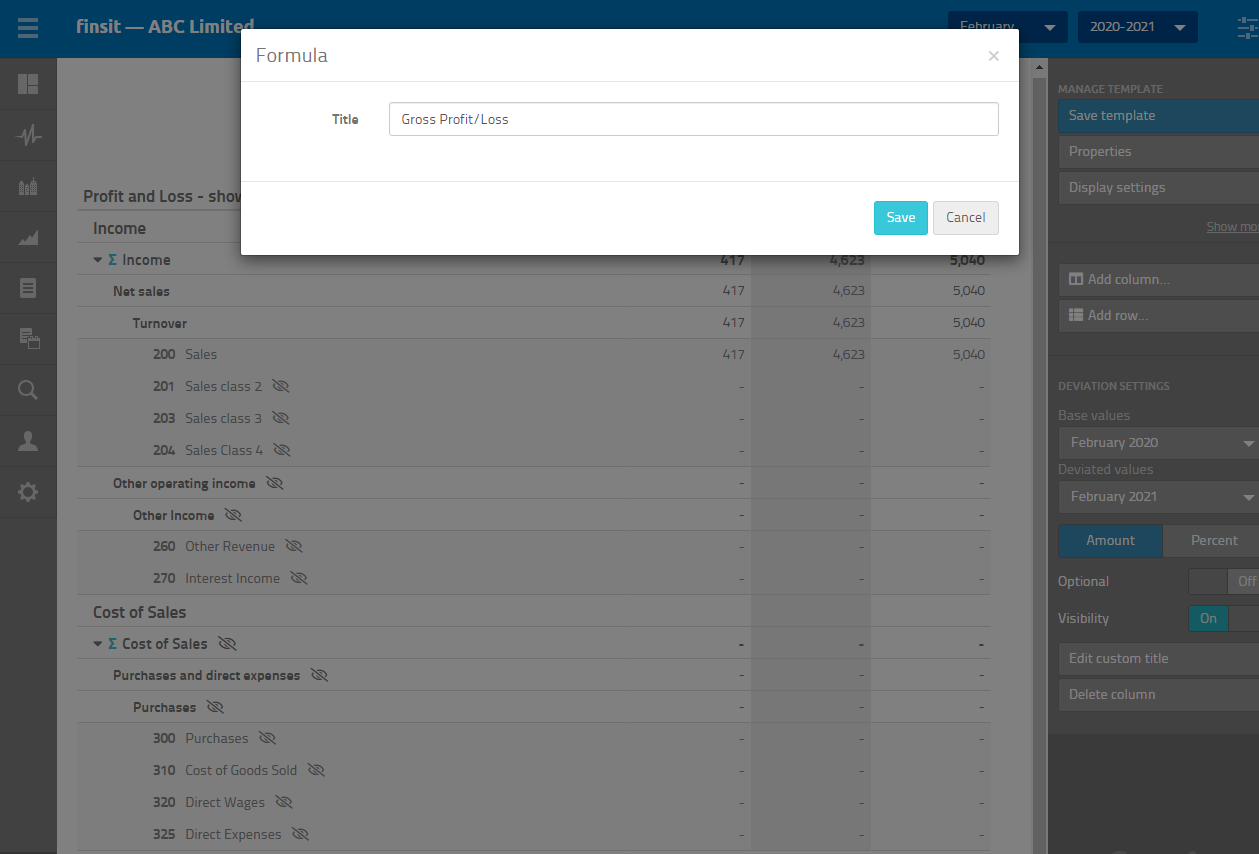
25. Click on Save
26. Click on Gross Profit/Loss within the report editor
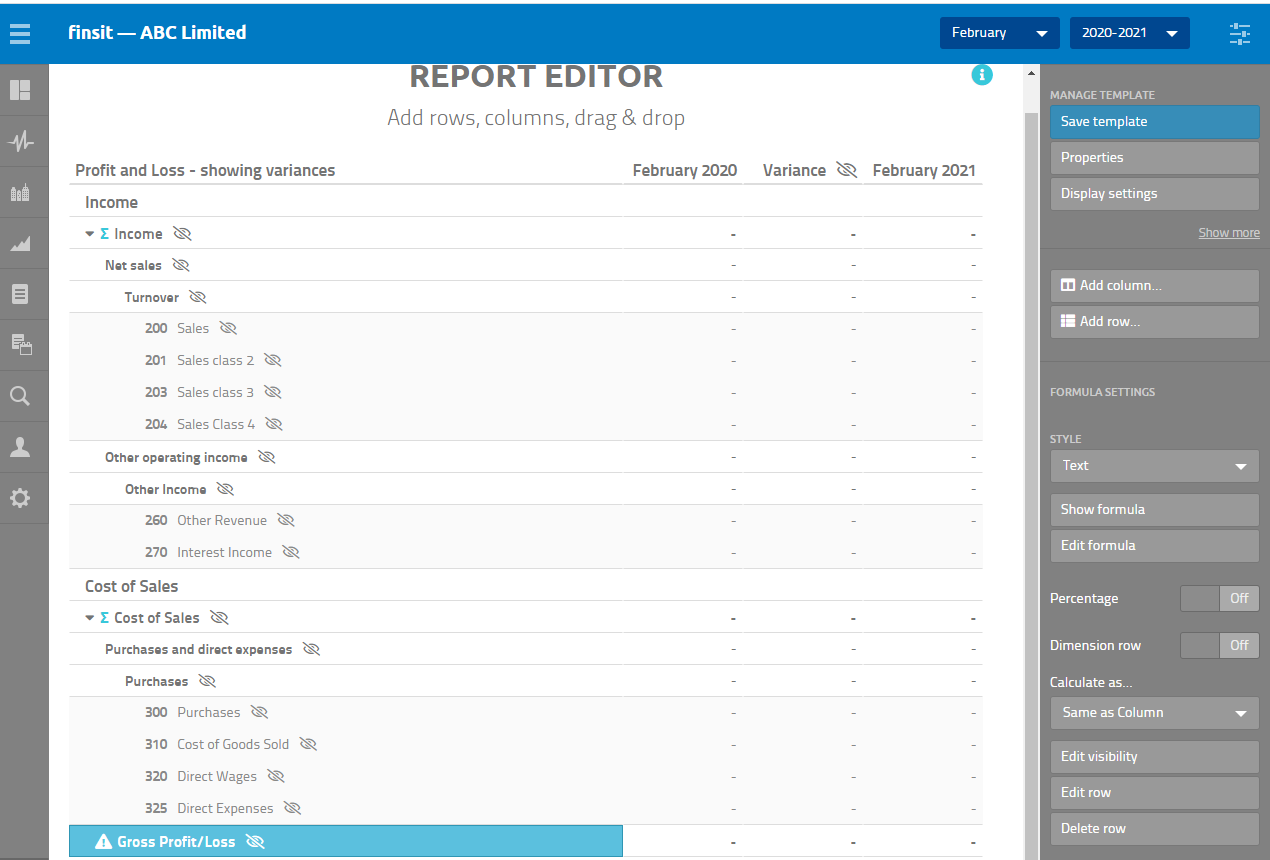
27. Click on Edit formula
28. Select Income within the Report Editor
29. Click on +
30. Select Goods for resale within the Report Editor
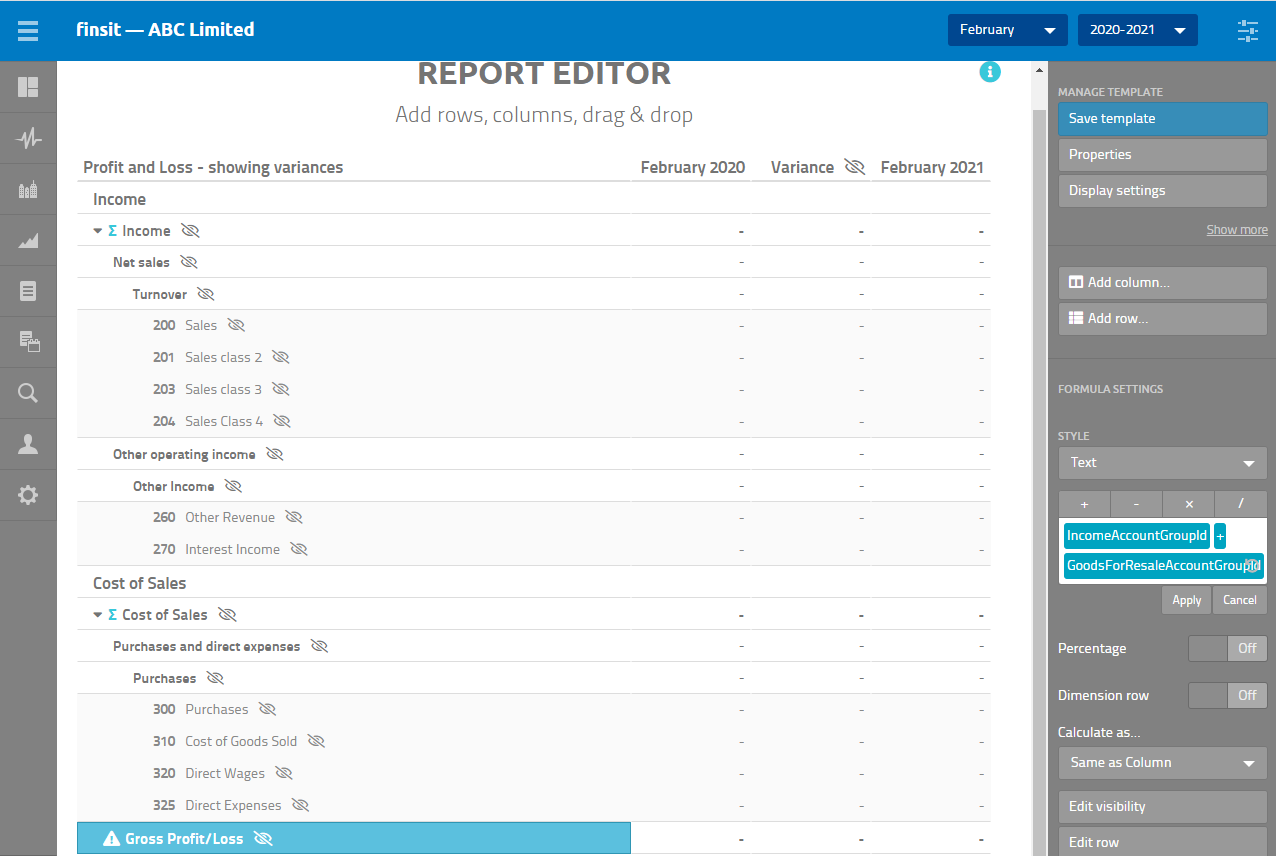
31. Click on Apply
33. To insert a blank row, click on Add row and select Separator
34. Repeat the steps above to add the other rows and sub-totals to complete the P&L.
35. Click on View report