Creating Reports

There are three options that can be used to create a report:
- Create using Wizard
- New grid
- New pivot
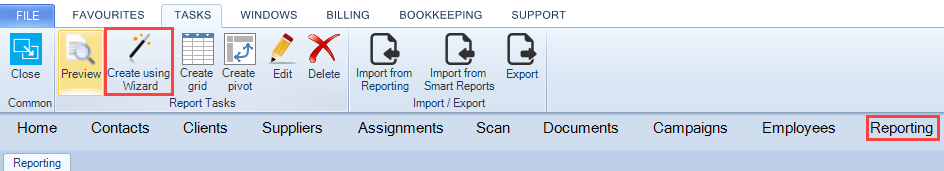
These options can be found on the Task Bar in the Reporting window.
Create using Wizard
The Create using Wizard option can be used to guide you through report generation.
From the main toolbar select Reporting, click Create using Wizard from the task bar.
The Report Wizard window appears.
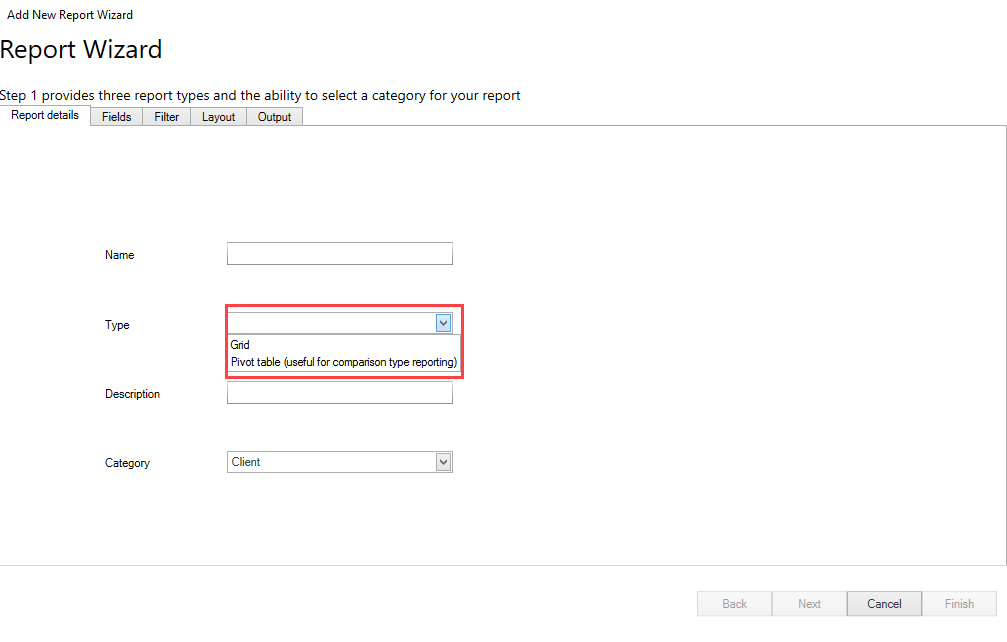
Step 1 - Report Details tab
Allows core information to be captured and used within the report. Add the information into the Report Details screen.
|
Name |
Entry of the report name is mandatory and is included on the printed report. |
|
Type |
Two report types are available for selection; Grid and Pivot Table |
|
Grid |
Allows you to create a simple report in a tabular format; the selected fields are shown in a grid. |
|
Pivot Table |
Allows you to quickly summarise the data and highlight desired information. The pivot table consists of Rows, Columns and Data which was determined by you on step 2 in the wizard. |
|
Description |
Entry of the Description is not mandatory, this is a useful area to detail how and when the report is used within the practice. |
|
Category |
A user definable option for grouping of reports. See Categories |
Click Next or the Fields tab to continue.
Grid
If Grid is selected from Step 1, then the Report Wizard window below appears in Step 2
Pivot
If Pivot is selected from Step 1, then the Report Wizard window below appears in Step 2 (the difference is the second column on the right side - Pivot area)
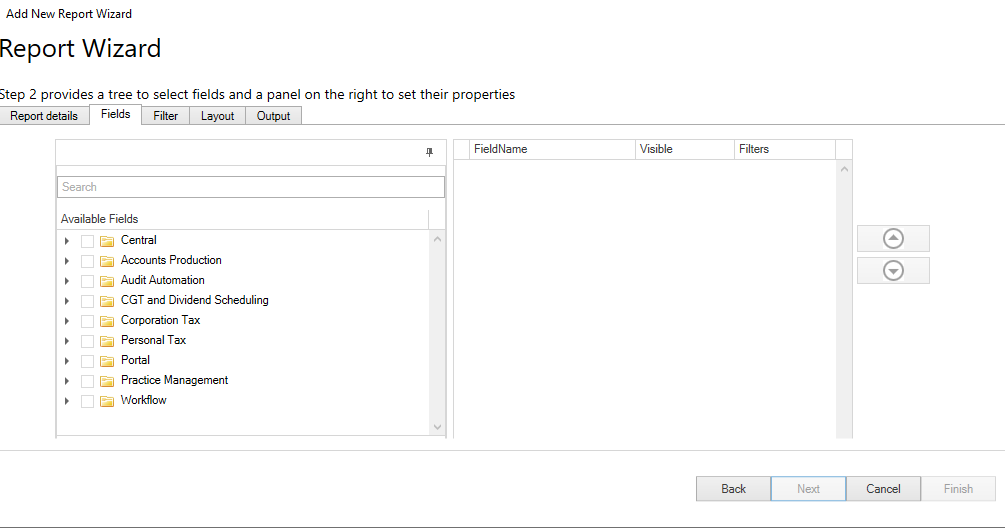
Step 2 - Fields tab
Provides a tree to select fields and a panel to set the properties.
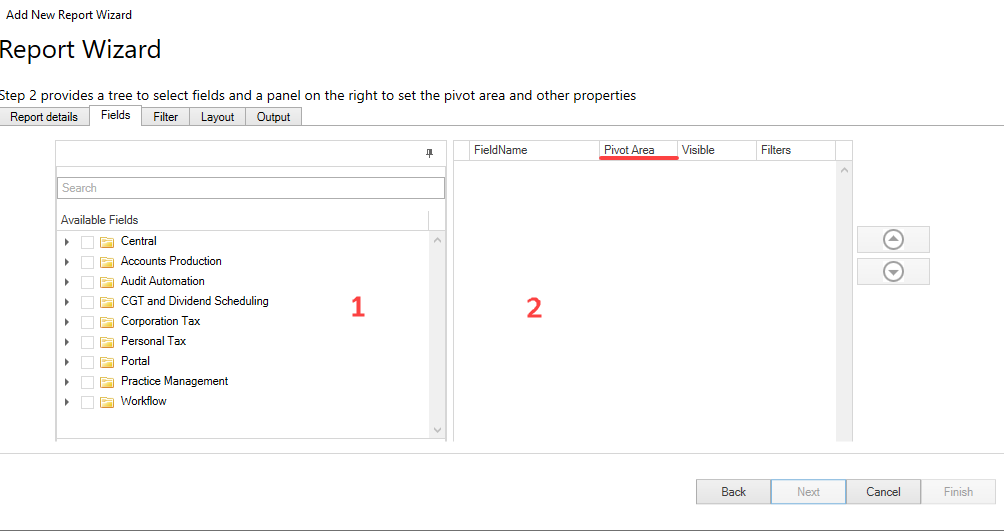
The Fields screen is made up of two elements:
1. Select the fields to be included in the report; this can be done using either the search facility or by expanding the Product Nodes. The products displayed are contingent upon your licence.
2. This area is used to determine ordering and formatting. When using the type Pivot Table, additional details need to be added to the Pivot Area column.
|
Field Name |
This is the field selected |
|
Pivot Area |
Allows you to set the pivot areas for the report. The display of the Pivot column is determined by the report type in step 1. |
|
Visible |
Determines whether the selected field is displayed within the final report. Note: If visible is not ticked, this allows the field to be used for filtering purposes but is not visible in the final report. |
|
Filters |
Allows you to set Prompt and Mandatory options on the fields. Note: This is the same as the right click functionality. |
|
Up/Down Arrows |
Allows you to reposition the field order |
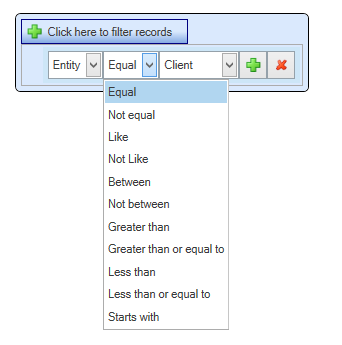
Step 3 - Filter tab
Allows you to apply filters to the selected fields.

Click the Click here to filter records button to access and apply relevant filtering. This has been adapted from and behaves in the same manner as CCH Central’s Advanced Search.
Parameters
The following is a list of available parameters.
If the report is to be searchable from the Find Clients “Search from reports” option, the Name field (which can be hidden) must be included in the report.
Step 4 - Layout
Provides a snapshot of the data to be returned.
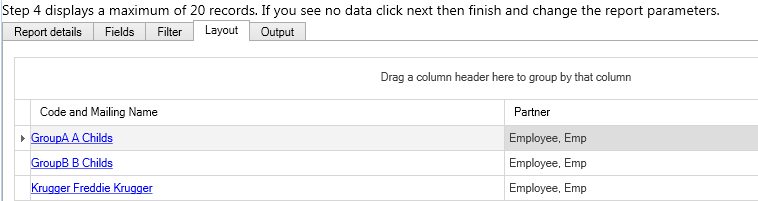
The number of records returned in the snapshot is determined by a configuration key. (See Configuration Keys)
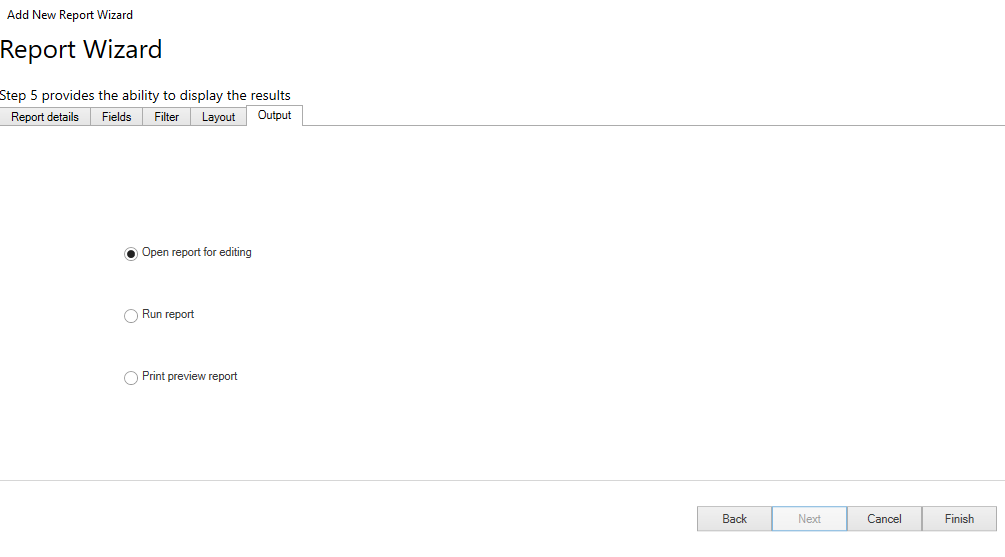
Step 5 - Output
Provides viewing options.
|
Open Report for Editing |
Opens report in edit mode displaying only the snapshot information |
|
Run Report |
Opens report in edit mode returning all records |
|
Print preview report |
Opens report in preview and edit mode |
Click Finish.
Create grid
Click Create grid from the Task bar.
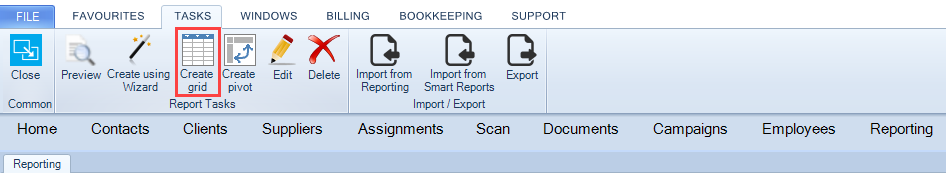
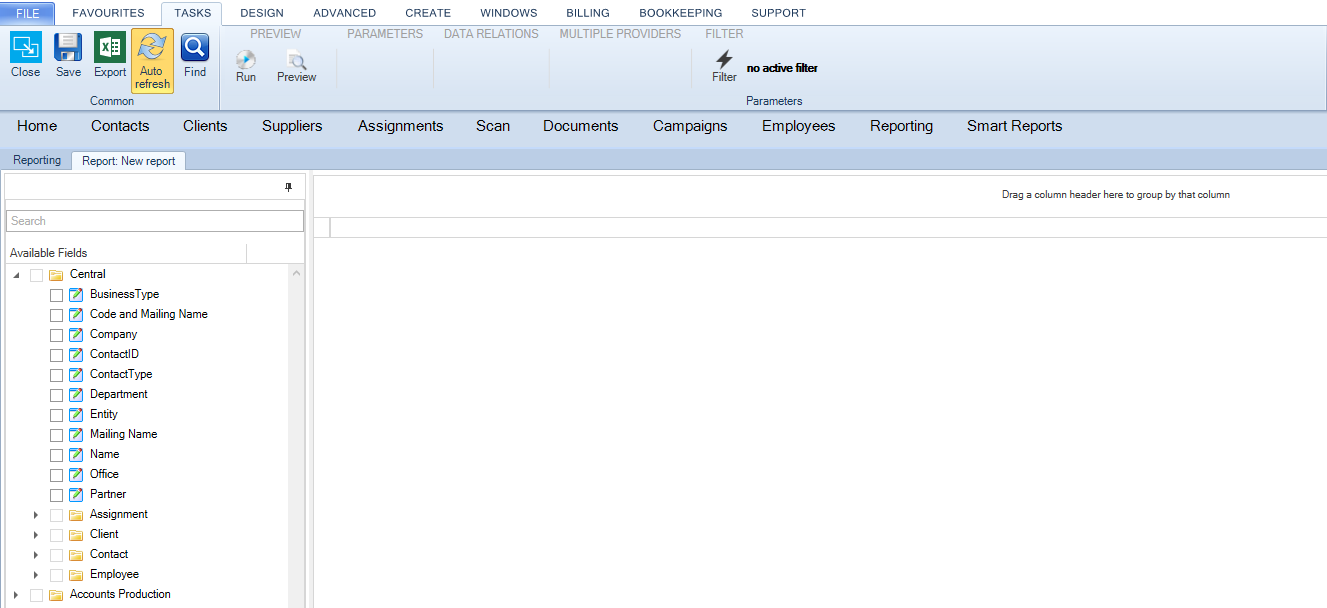
The Create grid option allows you to create a blank grid report.
To add fields within the report, expand the tree and select or drag fields into the grid.
Create pivot
Click Create pivot from the Task bar.
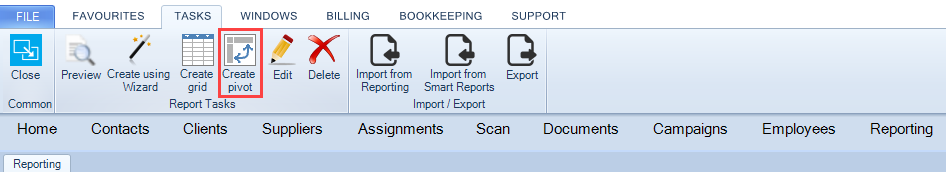
The New pivot option allows you to create a blank pivot report.
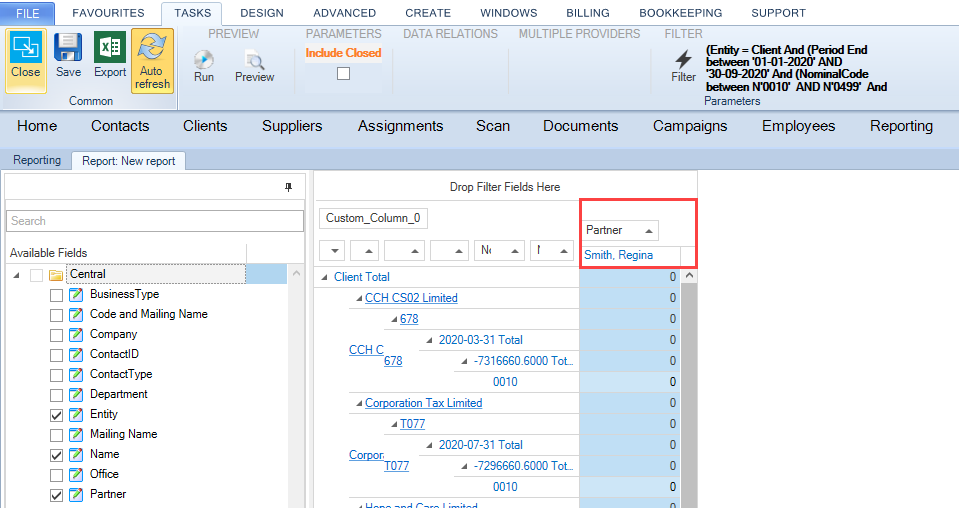
When selecting fields within the report, fields are displayed into the Row area.
To arrange the selected fields within the report, drag the header fields into the desired area.
In the example below, the Client Partner field is dragged from Row area into the Column area:
Unrelated Data warning message
When creating a new report, you may select field that are from different report categories and are not related to each other. The following warning message is returned to advise you that the report contains unrelated data.
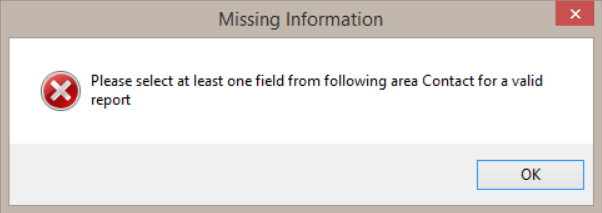
Missing information warning message
When creating a report, fields are generally selected from the Contact and Client areas, then any other plug in area.
The following message is returned when a report is created where fields are missing from the Contact area – eg: Name.