Trend Analysis

The system is capable of analysing trends from the trial balance history. These trends can be calculated at any time, through [Analytical tools] from the Planning menu, and a report can be obtained comparing projections with actual figures.
For the system to be able to calculate trends it must have at least 2 years historical data stored, however, the more historical information recorded the more accurate the trend calculations will be. If only 2 years data is available, the result will always be a straight line which is a perfect fit to the comparative data.
When the system calculates trend analysis, it computes 5 trend lines per account. It then looks at each of these and decides which line is the closest fit to the data, and selects it for the purpose of computing projections. For the technically minded, the equations calculated are as follows:
Linear - Straight line
Reciprocal - Figures increasing or reducing sharply and then levelling off
Log - A smooth curve
Power - A smooth curve
Quadratic - A curve with a maximum or minimum point
The closeness of fit of the trend line to the comparative data is calculated as a figure called the correlation. The closer this number is to 1 the better the fit of the line to the historical data, the closer the figure to 0 the worse the fit.
Trend analysis
On selecting this option, the system will calculate the best trend line for each account, produce a projection, and print a comparison of the projection against actual for those items which fall above specified exception limits.
To print, or view, trend projections, select Trend analysis from [Analytical tools] from the Planning menu.
The system will display the following dialog:
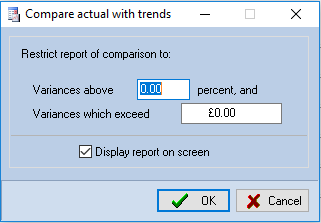
Exception limits dialog
The dialog allows you to enter the lower limits to be applied when deciding which variances to include in the report.
Enter the percentage above which you would like variances reported. For example, entering 7.5 will inform the system to print accounts only where the percentage variance exceeds 7.5%, and the monetary value of variances below which you are not interested. For example, if you enter £1,000 only variances exceeding this figure will be shown. The final option available is to direct the report to the screen rather than the printer, which is achieved by checking the Display report on screen check box.
After making your selections, click on [OK] and the system will calculate the trend lines, select the line of best fit for each account and prepare the variance report. It will then either present the standard Windows Print dialog for completion, or display the report in view mode.
After the exception report has been viewed or printed, the system will list the accounts which appeared in the report for you to view or print a graph of them. To do this, either double click on the account to be viewed, or click on it and then on the [Graph] button, and it will be presented. See the next section for more information on graphs and how to print them.
If, on accessing the Exception limits dialog, you decide you do not wish to proceed, click on [Cancel].
Updating current figures
To obtain the best results from Audit Automation, it is desirable to have the current year’s trial balance stored so that materiality calculations can be carried out and the audit pack customised, based on active areas of the trial balance. However, there will be situations where the engagement is to prepare the accounts and the audit is carried out at the same time. There are a number of ways that Audit Automation can help in these circumstances, one of which is to carry out trend analysis and instruct Audit Automation to generate a current year’s trial balance based on projections.
Where projections are used, the user should review the report produced to ensure that the correlation figure for each account is reasonable. Reasonable in this situation may be above 0.75, but should be considered for each case. The user can examine a graph of the account to see why the line selected may not be representative of the actual figures and, if necessary, revise the assessment of the projection by editing the current year’s trial balance.
It should also be noted that the system will arrive at an unbalanced trial balance and that the difference will be placed in the last account within the chart to make the trial balance agree.
The final action before carrying out the planning process based on a projected trial balance, is to review the overall trial balance in the light of any information which has been obtained during the year and adjust the figures for known events. For example, you may be aware that a revaluation of certain assets has taken place, or that additions were made, and reflect an estimate of these figures within the projected trial balance.
To update the current year’s TB to projections, select Calculate TB from the Utility menu.
The system will warn you that your actions will clear any current figures stored in the TB, and ask for confirmation that it should proceed. If you confirm that you wish to run the procedure, the system will calculate the trends and ask you to review the results. It will then display the trend analysis report, listing all accounts with details of the projections, and any current figures that may be stored in the trial balance, and the variance. Review the figures produced and then close the View Report window.
The final action, is for the system to ask for confirmation that the current TB should be updated. If you indicate that it should, by clicking on [Yes], the TB will be changed to reflect the projections. If you click on [No], the system will return to the Pack window without altering the TB. In both cases the system will analyse the TB on exiting from the routine.