Graph of Trends

Audit Automation can be requested, at any time, to display or print a graph showing the historical data and the trend line for any account within the trial balance. When graphs are produced, the system recalculates the trends for each account in case any changes have been made to the historical data since the last calculations. As indicated in the last section, Audit Automation will display a list of account exceptions when you run trend analysis and you may also view and print graphs from this list.
To produce a graph
Select option View/print trend graphs from [Analytical tools] on the Planning menu.
The system will calculate the trend lines and present the Graphs of actual results and trend lines dialog, listing the nominal accounts for you to select the account to be graphed.
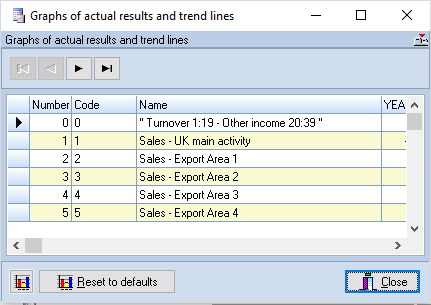
Graph of actual results dialog
You may scroll the list to the right to see the actual figures stored for each year, and scroll through the list of codes using the scroll bar or the navigation buttons. To view an account, either double click on the account in the list, or highlight it and click on the graph button at the bottom corner of the dialog box. Using either method will cause the system to display the graph.
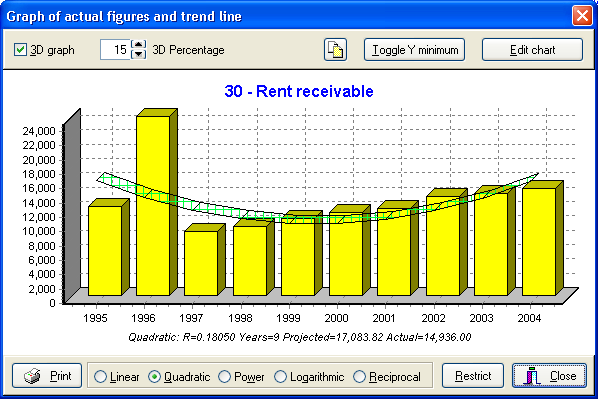
Display of actual results and the trend line
The trend line shown will be that which most closely fits the historical data. The type of line selected from the 5 equations is displayed at the foot of the graph, together with the correlation - shown as R on the screen - and details of the number of years used for the calculation, the projected and the actual figures. However, you may wish to see, in graphical form, the other 4 lines which were calculated, and you can do this by clicking on the radio button by the name of the line to be viewed.
The [Restrict] button at the foot of the dialog, allows you to restrict the number of years used for trend analysis for a particular account. This allows you to exclude older year’s data where they are out of line and are distorting the current projections.
To use this feature, decide on the number of years that you wish to use and click on the [Restrict] button. The system will display a dialog inviting you to change the number of years used for the calculation, either enter the number to use, or use the scroll buttons to change the number and click on [OK]. The system will recalculate the trends for the account and redisplay the graph using the revised trend.
For the options available when viewing graphs on the screen, please refer to the next section.