Lead Schedules

CCH Audit Automation provides for user definable lead schedules, allowing the production of lead schedules and other schedules. You may create up to 99 lead schedule formats for each audit area and there is no practical restriction on the amount of information contained in each.
The information required to produce a lead schedule is divided into two parts:
1. The report definition
2. The report format
· The report definition - The definition of the report allows you to inform the system of the page layout, defining such things as the report name, the number of columns of data, and the positioning of information on the page.
· The report format - The format allows you to define the contents of the report on a line by line basis.
As with audit programmes and checklists, it is also possible to set conditions to determine if a working paper should be printed, and sections of the format can be included or omitted on the bases of tests carried out.
To create or edit a lead schedule, load the master audit pack for editing, select Audit areas from the master pack index, highlight the audit area to which the lead schedule relates and click on [Lead schedules]. The Lead schedules dialog will appear in which will be listed any lead schedules already defined for the area.

Lead schedules dialog
This dialog provides options to allow you to add, edit, and delete lead schedules, and also to copy them from one audit area to another, or to another number within the same audit area.
Adding, or editing, a lead schedule involves two steps, first you must create or edit the report definition, using the [Add] or [Edit] button and then edit the report format using the [Edit details] button.
Adding a report definition
To add a report definition, click on the [Add] button and the Report definition dialog will be displayed.
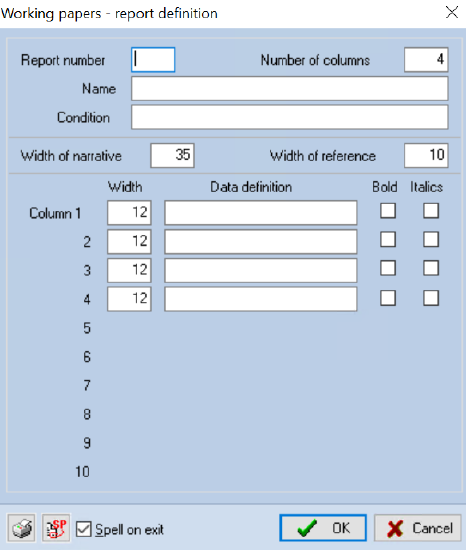
Report definition dialog
This dialog allows you to enter all the information required to define the layout of the report.
· Report number - The report number may be from 1 to 99 and identifies the report to the system. Each report must have a unique number, but it is not necessary for the numbers to be consecutive. The number of the report determines the order in which the report will be listed and printed.
· Number of columns -The number of columns determines the number of columns that will be shown on the report, and may be from 1 to 10. Each column contains a data definition, position on the page and width, see below.
· Name - The name of the report. This may be up to 50 characters and is used in display lists and to head the report when it is printed.
· Condition - This field will contain the condition that will be applied by the system to determine if the report should be printed, or it may be left blank to indicate that no condition applies to the report. For full details on how to enter a condition and the condition test available, see page 87.
· Width of narrative - The narrative, used to identify data on working papers, will always appear to the left of the data and may be followed by a reference column, see next item. The width of the narrative is defined in this field and may be from 10 to 50. If there are only a few columns of data on the report you may wish to have a wide narrative, but if there are a lot of columns you may wish to reduce the width of the narrative to make the report easier to read.
The width is defined in characters based on the font used to print the report. Audit Automation defines a standard character width to be rds of the font height. When narratives are printed they are word wrapped to fit in the defined width.
· Width of reference - The reference column, which appears after the narrative and before the figure columns, can be defined to be from 1 to 30 characters wide. The system will not to include the column in the report if the column is defined to be 1 character.
Column definition
The bottom half of the dialog is where you define the data you wish included in the report, the width of the columns and how each is to be printed. The system will only display entry boxes for the number of columns that have been defined in the Number of columns field.
· Width - This field determines the width of the column on the report, which may be from 8 to 15 and will default to 12. Where appropriate, figures are printed with “,” separators and a money sign and the defined width needs to cater for this. In addition, it is possible to have working papers printed in round pounds, or to any number of decimal places up to 4 and this also needs to be taken into account if the working paper is to include decimal places.
· Data definition - This field is where you define the data that is to appear in the column. The data definition will be used whenever the line to be printed is a data line, see later, and the data selected on the line to be printed in the column is drawn from an appropriate source, i.e. the trial balance or classifications, or the definition is such that it does not require data, e.g. a total column. The definition is in the following format:
Operand [Operator Operand [Operator Operand]]
I.e. you may have a single data type defined, the operand, or up to three data types combined in a calculated result for the column. The allowable entries for the operand are as follows:
|
Operand |
Nature of operand |
|
ACCX |
Any data to be included in this column drawn from the nominal, to be of the type defined by “X”. “X” may be one of the following: 0 Current year client TB, to 9 TB of 9 years ago A Total of adjusting journals C Current year after adjusting journals R Total of reclassification journals T Current year after all journals J Total of all journals U Total of unadjusted errors |
|
T01X9 |
Any data to be included in this column drawn from the nominal ledger, to be restricted to the balance of a specified TB where “01” is the number of the TB. “X” defines the type of data to be extracted for the specified TB and may be one of the following: E Balance on the account as entered by the user C Balance converted using the factor for the year A Adjusting journals R Reclassification journals J Total of all journals T Total on account after all journals The final element “9” represents the year to be extracted, “0” for the current year to “9” for 9 years ago. For the journal codes, you must specify year “0” as this information is only available for the current year. |
|
CATXY |
Any data to be included in this column drawn from classifications, to be of the type defined by “X” and the category defined by “Y”. “X” may be one of the following: O Original client TB balance A Total of adjusting journals C Current year after adjusting journals R Total of reclassification journals T Current year after all journals J Total of all journals U Total of unadjusted errors and “Y” may be one of the following: - Total for category B Brought forward A Additions D Disposals R Revaluations P Profit and loss account items M Movements O Other items |
|
VARZ |
A run time variable. Run time variables may be calculated, and recalculated, in the report format and can therefore be used to vary, say, a denominator for a column as a report progress. E.g. this could be used to produce a column that expresses everything as a percentage of total sales. 36 run time variables are available and “Z” may therefore be any letter from A to Z, or a number from 0 to 9. |
|
BAL99 |
A reference to the total of another balance, i.e. column. Columns are calculated from left to right and you should therefore only make reference to previous columns when defining reports. “99” can be a number form 01 to 10, it must be typed as two characters. This feature can be used for carrying out column arithmetic, e.g. if column 1 contains data for the current year and column 2 the previous year column 3 could be defined as a movement column by deducting BAL02 from BAL01. |
|
(9999) |
A constant figure. “9999” can be any valid number and could, for example, be used to produce reports in ‘000 by dividing data by (1000). |
|
SUM |
The total of all columns to the left of the current column. |
The allowable entries for operators are set out in the following table:
|
Operator |
Nature of operator |
|
+ |
Add the next operand to the accumulator |
|
- |
Deduct the next operand from the accumulator |
|
* |
Multiply the accumulator by the next operand |
|
/ |
Divide the accumulator by the next operand |
|
% |
Express the accumulator as a percentage of the next operand |
· Bold and Italics - These two columns of check boxes allow you to define if the figures for the column are to be printed in bold and/or italics. If the check box is checked then the print formatting option is active for the column.
The following examples demonstrate how report definitions may be used to achieve different types of working paper.
Standard lead schedules
Most standard lead schedules will have columns showing the figures as provided by the client in the original trail balance, any audit journals made, the figures per the final accounts and the comparative data.
The definitions of such a report may be as follows:

This defines a report containing four columns, as follows:
Column 1 Current year data drawn from the original client TB
Column 2 The total of all journals
Column 3 The total on the account after the journal entries
Column 4 Last year’s figures
A narrative is to be included with a width of 30 characters and this is followed by a reference column. The total column will be printed in bold and the comparative figures in italics. This definition is for the stock lead schedule and the condition is a test to see if there is any stock. The total of the classification STK will be examined and if it contains zero the schedule will not be printed.
Column 3 could have been defined as BAL01+BAL02 or SUM and the result would have been the same.
Percentages
We may wish to define a report listing all expenses, showing the total for each account and that total expressed as a percentage of sales. The report may be defined as follows:

Here we have defined four columns and made reference to runtime variables A and B. These variables would be calculated at the beginning of the report, A to hold the total of sales for the current year and B to hold that for the previous year, see below, and once defined will be used for each line of the report to calculate the desired percentages.
Column 2 This definition tells the system to take whatever has been printed in column 1 and express it as a percentage of variable A.
Column 4 This definition tells the system to take whatever has been printed in column 3 and express it as a percentage of variable B.
Report in ‘000
To produce a schedule expressing figures in thousands, simply divide the data by 1,000.
For other examples look at the report definitions in the master packs provided, in particular fixed assets where all columns are defined as relating to the current year.