Period Reports

Period Reports Feature
With this feature, you can create easy to understand reports that are published in finsit and are available to your client and everyone who works with the client assignment.
The period reports contain
- The practice employees comments
- Activity Graph
- Summary profit and loss and balance sheet
- Key figures
- Detailed profit and loss and balance sheet attached as a PDF
1. To create a report, select Period Report in the left-hand menu

2. Select New Report from the right-hand menu.

Period - select which period to report, using the period picker in the header.
The report title - automatically generated and can be changed
The report's subtitle - automatically generated and can be changed
Comment - write your comments for the period
Standard Texts - Select the standard text that you want to add. If required you can edit the standard text in the report. If you want to create and update Standard Texts then these changes need to be made in Business Type settings in the Practice view. For more information refer to Finsit Practice Administration Guide
Show key ratios - are automatically generated. The key ratios can also be changed in the Business Type settings in the Practice view. For more information refer to Finsit Practice Administration Guide.
Appendices - the Profit and Loss and Balance Sheet for the period.
The entire report is clickable. You can click on the boxes below the graph (Profit, Accumulated profit, Income or Accumulated income) to change the data presented in the graph.

Directly under the Profit and Loss and Balance Sheet summaries, there are links to access the full reports. When you click on the link you will see the following pop-up. Select Navigate to report to proceed.

The KPIs can also be clicked on to get information about that KPI. Select View KPI to navigate to the KPI page.


Note: You can change which key figures you want as the default per business, refer to editing default KPIs at the business level section.
Once you have finished creating the period report you can select Publish and you will see the following.

3. Click Publish to continue and you will see the following report

Using the right-hand menu, you can:
- Print the report
- Export to PDF
- Withdraw the report (so that the customer will no longer be able to view the report)
- Create a new report from this report (this is a good option for providing customers with month by month updates)
- Show history (to see when the report was last updated)
- Send email notification - you will see this pop-up where you can select which users you want to send the report to

Once you publish the report, it will be locked and cannot be changed afterwards. The accounting data contained in the report will not be affected by deleting the current fiscal year or making any other changes. It is possible to recreate a published report, it is then hidden from the customer's view but the employee can edit and view.
Editing default KPIs at Business level
You can change which KPIs you want to report on under settings on the left-hand menu. 
1. Select Business Settings
2. Click on the KPIs tab

3. Click on Edit next to Period report KPI’s
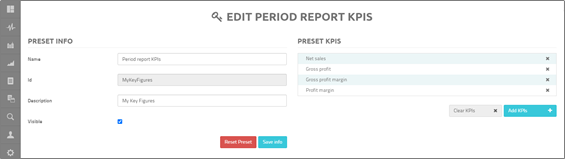
4. Click on Add KPI’s

5. Select the relevant KPI and click on Add selected

1. Click on Save info
The added KPI, will now be shown in any new Period Reports
