Toolbox: Recoverability

Toolbox: Recoverability Option
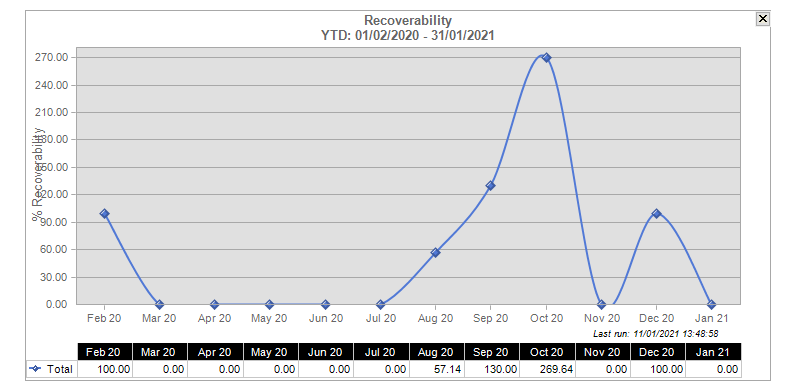
When you drag the Recoverability option from the Toolbox, you see the recoverability graph.
The information on the graph will be displayed in monthly figures. The monthly figures, however, will not be figures for a calendar month in a year, but will use a year to date figure for the month being displayed.
As an example, if the graph contains a figure for January 2021, the figure will actually be the cumulative figure using the profitability information from 01/02/2020 to 31/01/2021 and February 20021 will be worked out as the profitability figure from 01/03/2020 to 28/02/2021.
For the rolling average, you will use today’s date as a basis for the last month. Therefore if today’s date is 31/01/2021 then the figure for January 2021 will be from the 01/12/2019 to 3/12/2021.
Right-click the display to show the pop-up menu. From this menu, select:
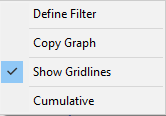
- Define Filter and the Recoverability Grouping Options window appears. From this window you can choose to include criteria for the recoverability graph and also customise the dates applied to the graph. You can choose from:
- YTD: Displays figures for the previous 12 months starting with today's date.
- Date Range: Displays figures for the date range entered. You are limited to 12 months and the start and end dates must be entered.
- Cumulative: If left unselected, the graph will display in calendar months.
You can also sort by dragging any combination of column headers into the sort area as shown on the Recoverability Grouping Options window. You can sort by:
- Company: To display a list of Client Companies in the Practice.
- Department: To display a list of all Client Departments in the Practice
- Office: To display a list of all Client Offices in the Practice.
- Partner: To display a list of all Partners in the Practice.
- Manager: To display a list of all Clients in the practice.
You can also filter what you want to see in the sort by column. Right-click on any column header and a Filter selection box appears. Select the filter criteria and click OK and then drag the column header to the sort area on the Recoverability Grouping Options window.
- Copy Graph to copy and paste the graph into another application.
- Show Gridlines to turn on and off the gridlines on the graph.
- Cumulative to display the graph in calendar months.