Overview Feature

The Overview, Business Trend and the Business Activity Feature
The first view that you see is called Overview, which gives you an overview of the client’s current financial performance.

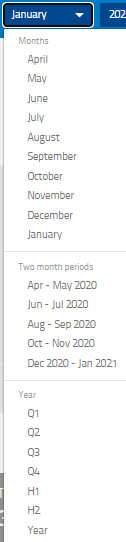
You can adjust which period you want to view in the upper right corner.
The first graph automatically shows Profit/Loss per month (bar graph) and the corresponding accumulated Profit/Loss for the same period (line graph). You can click on the four boxes below the graph (Profit, Accumulated profit, Income and Accumulated income) to add or remove elements in the graph.

Scrolling down the overview page gives you a snapshot of the company's financial position. A little further down are KPIs and leader boards for different periods are shown.

Business Trend Feature
From the left-hand menu, you can select Business and then Trend. You can use the period picker in the header to change the period in the Business Trend view.
The Trend view automatically compares the current results to last year results. You can change the comparison year by selecting a different year in the right-hand menu.
You can click on the eight boxes below the graph (Profit, Accumulated profit, Income and Accumulated income) to add or remove elements in the graph. The blue dialog box automatically generates a commentary based on the differences between the two years that you are comparing.

Business Activity Feature
From the left-hand menu, you can select Business and then Activity. You can change the period using the period picker in the header.
The Business Activity feature automatically shows the user the daily income and costs (bar graph) and the corresponding profit (line graph).
You can click on the six boxes below the graph (Income, Costs, Financial items, Appropriations, Taxes and Profit) to add or remove elements in the graph. You can show activity for the full business or for individual tracking codes and break it down daily, weekly and monthly.

You can click on any date in the graph and the user will be shown all of the income and cost elements that have been accounted for on that date. You can click on any of the links (blue text) to further drill down into the activity.
