Entering Data into Grids

Entering data into grids
Grids display data in tabular format characterised by rows and columns. The data is displayed in rows with a context-sensitive number of columns containing pre-determined column titles.

You are able to use the tab key to navigate through cells in grids once you are in the first cell.
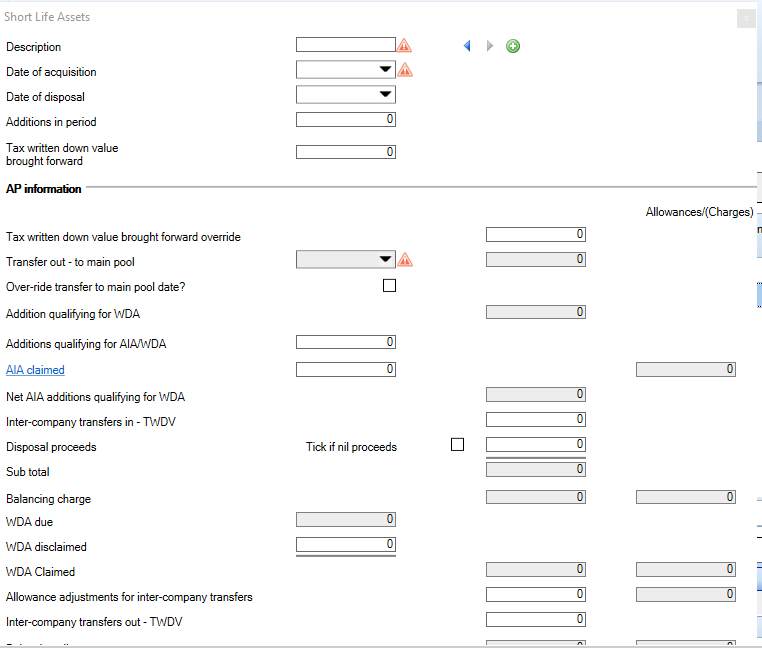
In some grids, clicking on this first cell will launch a separate window into which you must input your data eg. Short life assets, Other assets, BPRA.

White fields are editable fields.
Grey fields are un-editable and will be automatically populated with system-calculated values.
Description fields will allow input of alpha-numeric values.
Fields with a downward arrow contain a pick list, from which values should be chosen.
Date values can be manually entered or input using the arrow to display the date picker.
Some grid cells contain an elipsis icon  which allows you to search and select other data from other areas in the software e.g:
The company fields in CT600C Claims and surrenders to group relief.
The participator name in CT600A - Loans to participators.
Some grids are effectively a summary of data entered into underlying screens via 'secondary analysis'.
