Medical Master Pack User Guide

Overview
This master pack for CCH Accounts Production caters for the generation of accounts for up to 40 Partners, with a code structure supporting 999 partners. Tax Link data for CCH Personal Tax is provided, from Master Pack 11 onwards.
Terminology
- The formats use the standard terms set out within "alternative words", which can be amended at the practice level.
- For Medical packs, the terminology for the financial information produced - ie "accounts" vs "financial statements" - is set within #aw1 (for most other entities, #aw3 is used).
Limitations of Scope
- Incorporated medical practices are not supported.
- Formats currently cater for up to 40 partners
LINK Nominals
Using linked nominal codes
“Linked nominals” creates a set of nominal codes for each partner, using the partner name from the list of officers. It is only applicable to Partnerships. The Link nominals screen is to be used after adding the Officers. In this example we have used 3 officers:

There are 2 main areas on this screen.
Section 1 : This shows the partners and key information about their display. In this section, only the Nominal sub code and tick box are configurable.
Section 2 : This shows the ranges that the linked officer information will be applied to. This information is only configurable at a maintenance level and not at client level.
Entries to make
Nominal chart descriptions amendment:
The linked chart codes can be amended to use descriptions that will aid nominal entry and give the correct presentation in the accounts. For instance, the default description for nominal code 9700 will be replicated for each linked officer as follows:

If the description in 9700 is changed to "Cash drawings" and the nominal link is run for the first time or re-run subsequently, this is the result:

Note: The nominal link can be re-run at any time, and it will simply overwrite the original descriptions.
The chart codes that could be amended are listed elsewhere in this guide. Normally, the codes that are most helpful to amend are:
9700, 9712, 9713 etc Drawings codes
9600, 9610, 9620 etc Current account types
9500, 9510, 9520 etc Capital account types
Users should only amend codes they expect to use.
Nominal sub codes allocation to officers:

- The first time you open this screen, each officer will be automatically allocated the first available sub code.
- The allocated sub code can be manually changed if required, until there is a transaction in any of the linked nominals for that officer: after this, the sub code cannot be changed.
- The sub code can be any number between 001 and 999.
Tick box in left hand column: Use the tick box to select which officers to create linked nominals for.
Order: This reflects the order of the officers as they appear on the Officers screen.
Name: This is the officer name as it appears on the Officer screen
Is former Member: This will indicate if the officer is former or current
Available for deletion: This indicates if the officer can be deleted or not.
An officer cannot be deleted if either condition applies:
1. There are transactions on any of that officers linked nominals
2. They were an officer in a prior accounting period
Create nominal linking:
Once the nominal Subcode is set, you will need to create the sub codes. To do this you will need to select the tick box then use the ‘Create nominal linking’ button.

Multiple officers can be selected when creating sub codes. The "create nominal link" procedure can be rerun even if linked nominals already exist. Duplicate sub codes will not be created for the same nominal.
The sub codes do not need to be continuous. In this example we have used sub codes 001, 050 and 500:

Delete former officers\Recycle used sub codes
Former Officers can now be deleted and their linked nominals released together with the associated sub code. A former officer can only be flagged for deletion if there have been no balances on any of the linked nominals for that officer for 3 years. Once the conditions are met you will be able to flag the offer for deletion, as below:

When you flag an officer you will get the message

Note: Officers cannot be unflagged
Officer Ranges
Officer Ranges are collections of nominals that are subcoded for Partners. To access Officer Ranges: Maintenance > Accounts > Officer Range

- Name
- Description
- Start Nominal/Start Category
- End Nominal/End Category
- Nominal type – Balance sheet or Profit and Loss
- Close Off Account
- If Nominal type = Profit and Loss then default set to 9900 Retained profit.
- If Nominal type = Balance sheet then close off will default to but can be manually set any other main account
Practices can create their own ranges in addition to any provided as standard.
Example of practice level officer ranges

Medical officer ranges
Officer Ranges are grouped into 4 distinct areas
• Current accounts
• Capital accounts
• Drawings
• Prior allocation of profits
| Current accounts | From | To |
| Cur01 Cur02 Cur03 Cur04 Cur05 Cur06 Cur07 Cur08 Cur09 Cur10 |
9600 9610 9620 9630 9640 9650 9660 9670 9680 9690 |
9609 9619 9629 9639 9649 9659 9669 9679 9689 9699 |
| Capital accounts | ||
| Cap01 Cap02 Cap03 Cap04 Cap05 Cap06 Cap07 Cap08 Cap09 Cap10 |
9500 9510 9520 9530 9540 9550 9560 9570 9580 9590 |
9509 9519 9529 9539 9549 9559 9569 9579 9589 9599 |
| Drawings | ||
| Cash Drawings types 2-10 Drawings types 11-20 Private income drawing Personal expenses Personal tax payments Superannuation |
9700 9712 9724 9735 9754 9774 9789 |
9711 9723 9730 9749 9763 9783 9810 |
| Allocations | ||
| Prior allocation 1 Prior allocation 2 |
5400 5470 |
5469 5546 |
| Other | ||
| Partner expenses Tax and superannuation liability |
4950 8191 |
4959 8197 |
Statutory Database Choices
General settings

Note: that accounting policies will not be shown unless this box is ticked.
Sole traders
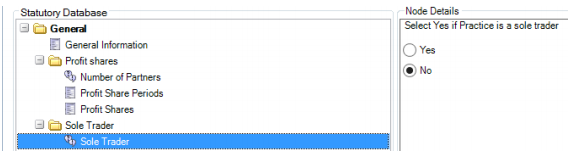
Selecting “Yes” will adjust the formats to show “Proprietor” rather than “Partners”, and other wording will change accordingly.
Number of partners
Selecting “Yes” will trigger alternative formats in some places (eg capital and drawings accounts).

Balance sheet disclosures (see Formats section for detail)

For each of the categories above (debtors, bank & cash, current liabilities and long term liabilities) the user can choose whether to show fuller analysis on the balance sheet and whether to show a detailed note.
Appropriations and drawings (see Formats section for detail)

Users can either use the summary note for appropriations, or trigger a more detailed note to show allocation in each period.

The summary and detailed drawings notes can be suppressed
Nominal Ledger
The nominal ledger for medical partnerships is a 4 digit chart of accounts, with 3 subcodes available for some accounts. The coding structure adopted in these formats differs from that used for standard partnerships and is designed to cater for the requirements of medical practices.
Nominal coding structure
The nominal chart has the following key identifiers:
- Code ranges that group similar items together (eg Staff costs are shown in one area)
- Descriptions that enable the user to understand the posting ("GMS income")
- Category information which identifies where a posting will end up in the financial statements ("Medical expenses")
The nominal chart is searchable both by browsing through codes and by entering text. The chart displays the 3 identifiers above in data entry and information screens, so as to help identify of the correct account to use. Subcodes have been used as follows:
- All income codes apart from reimbursement codes (0140-0239 and 0301-0399) have been set up with 99 subcodes, the last 10 of which have been designated as deductions. Posting to the deduction subcodes will trigger a subtotal in the formats.
- The following nominal codes have been sub accounted by partner, thereby catering for up to 999 partners:
|
Prior allocation of profits Creditors - Partner tax Creditors - Superannuation Partner Capital accounts Partner Current accounts Partner Drawings analysis |
5400..5555 8191..8196 8197 9500..9599 9600..9699 9700..9810 |
The overall structure of the nominal ledger is as follows:
Income and expenditure account
| Fees and allowances Employer superannuation Drugs costs Staff costs Other income Prior allocation profit shares |
0001 - 0040 0245 - 0249 0500 - 0999 3000 - 3091 4000 - 4499 5400 - 5555 |
Other NHS Income Non NHS Income Medical expenses Other expenses Finance costs Partners' expenses (where shown as a line in I&E) |
0101 - 0244 0300 - 0499 1210 - 1269 3300 - 3999 4500 - 4599 4950 - 4959 |
The following headings have been replicated in Other NHS Income and Non NHS Income:
| Outside appointments Reimbursement of expenses |
0102 - 0106 and 0400 - 0410 0140 - 0239 and 0301 - 0399 |
Balance sheet
| Intangible assets Tangible assets Investment properties Fixed asset Investments Stock Debtors Current asset investments Cash in hand Assets held for sale |
6000 - 619Z 6200 - 669Z 6700 - 674Z 6950 - 6999 7000 - 7099 7100 - 749Z 7500 - 7799 7800 - 789Z 7900 - 799Z |
Creditors and accruals Current tax liabilities Current borrowings Creditors more than 1 yr Partner capital accounts Drawings |
8000 - 814Z 8150 - 819Z 8200 - 889Z 9000 - 9499 9500 - 9599 9700 - 9810 |
The chart caters for 10 types of Capital account and 10 types of Current account. The first current account (codes 9600 - 9609) is classed as the main current account from which drawings are made, and to which the residual share of profit is added.
Codes used for prior allocations of net income
These comprise the following codes:
| Partner capital accounts allocations Main current account allocations Allocations to Current accounts 2-10 |
5400 - 5449 5450 - 5515 5516 - 5555 |
The above codes are subanalysed by partner - 001-999; these codes are used to produce the analysis of the Allocation of Net Income. The other side of postings will be the relevant profit share accounts for capital and current accounts in the range 9500..9699.
Examples:
9509 001 - Capital account 1 - share of income - partner 1
9609 001 - Main Current account - share of income - partner 1
9619 001 - Current account type 2 - share of income - partner 1
Allocation of residual profit shares
This is achieved using two tables in the statutory database. (See Profit Share Allocation within Statutory Database)
Options for showing partners' individual expenses paid by partners
This might include such costs as:
- Motor expenses where the partners drive their own cars
- Professional subscriptions paid for by the partners
- Training courses they paid for
- Their use of their homes for work
There are three options anticipated within the master pack:
- These costs can be excluded entirely from the medical partnership costs. They would therefore be included only within the individual partners' tax returns.
- The costs can be included within the normal I&E account headings (eg motor expenses), with a double entry to the relevant drawings accounts codes (subcoded by partner) as a credit for personal expenses 9754-9763 (eg 9754 Personal exp type 01; 9755 Personal exp type 02; 9756 Subscriptions; 9757 Courses and conferences).
- Where the user wants to distinguish between shared partnership costs and individual partners' costs, the total of the partners' expenses can be shown as a separate line at the end of the I&E. This approach will also trigger a note to the accounts to show an analysis of these expenses by partner. In this case:
- The costs will be charged by debiting codes 4950-4959 subcoded by partner (eg 4950 Motor expenses; 4951 Use of home; 4952 Subscriptions etc)
- Where the costs were paid for by the individual partners, the double entry would normally be credited as a total for each partner to the current account 9607 Other movements - Partners' expenses (subcoded by partner). Alternatively, the double entry could be to the drawings accounts as noted above.
- Where the practice paid those individual partners' costs, the double entry would instead be to the practice bank account.
Note that where the second or third option is chosen, normally the user will also wish to treat the partners' expenses as a prior share against profits, achieved by crediting the total of each partners' expenses to 5511 Allocations - Partners' expenses (subcoded by partner) , with a debit to 9609 Share of net income (subcoded by partner).
The descriptions for Partners' expenses can be overridden in 9607 and 5511 and on the I&E using the statutory database grid for that area.
Where the third option is not chosen, then the codes 9607 Partners' expenses (within other current account movements) and 5511 Partners' expenses (within prior shares) can be used for other means, simply by changing the nominal code names.
Profit Share Allocation
Within the statutory database Under General / Profit Shares there are two tables:
1. Profit share periods
This screen is used to set the profit periods

Enter the start and end dates for all the required periods (single or multiple). The grid will then calculate the total number of days in each period and also the share of net income (after prior allocations) allocated to that period, based on its length. The “Profit override” column is used to override the calculated profit figure where an actual profit has been separately calculated (after other appropriation), eg in the management accounts. Note that the “Profit calculated” figure at the top should agree to the “Net income allocated” figure below it
2. Profit shares
This is a separate table for entering the profit sharing ratios for partners by period:

Enter each partner's profit share ratio for each period. The grid will calculate the profit share for the period for each partner and will sum the individual period shares in the total column. The profits are rounded to the nearest £1, which may lead to the total figure allocated being more or less than the profit available. The “Round” column is used for allocating any rounding difference among the partners.
Above the table is shown:
- Profit calculated – This is the sum of the amounts to be allocated, as shown on the Profit Share Periods screen.
- Differences – This shows the amount under or over allocated in the table, compared with the calculated total figure.
Note: the Profit Shares and Periods need to be defined in each accounting period, and will need to be revisited after the year-end procedure.
Automatic checks and roundings
In the first table, a check is also carried out for the total days entered. In the second table, the grid displays the totals of the ratios and profits allocated, together with any remaining differences. This enables the user to check whether the entries made successfully allocates the total profit. The profit shares calculated are automatically rounded. The screen will not show decimals (some columns will appear not to cast) and rounding differences may occur. The total net rounding difference will show in differences field below Net income to allocate. This needs to be allocated manually to the partner(s) chosen by the user.
Profit share close off
On the Officers tab you will need to set the Profit Share Close Off Account, as this is used for posting the profit share journals created during the year end process. The normal close-off account is 9600. The automated journals will allocate profit shares to the relevant partner subcodes.

Other Information
Spare groups
To give reporting flexibility, the chart includes a number of spare income and expenditure groups which appear on the face of the Income and Expenditure account with detailed analysis in a note. The descriptor on the face of the accounts is taken from the main code description in the chart. For instance, the 4th item in "Fees and allowances" takes its description directly from 0021, "Spare fees and allowances group 1". Changing that nominal code description will therefore change the item description in the I&E and in the note. See Appendix 1 for a list of income groups.
Employer's superannuation as an I&E deduction
There are two ways to show this.
- It can be shown as a deduction from a specific income group, and a single code has been set up for that purpose within the PMS income range (0011091). Note that other income deduction code(s) can be used, but the nominal description will need to be amended.
- Alternatively, it can be shown as a separate line on the I&E by posting to the separate superannuation codes, 0245-0249. Where only one of these five codes is posted to, a note will not be triggered unless a text note has been raised. If more than one code is used, the note will be included and show the analysis.
Dispensing account
Drugs income and drugs costs are shown separately in the I&E. The drugs income note will show an analysis of the income, with a total that agrees to the I&E figure for income. Below this it shows also the drugs costs total (the detail of which is shown in a separate note), followed by the net income from dispensing and the % return on cost.
Enhanced services
There is an option flag in the Enhanced Services folder of the statutory database (#md91). This provides the option to group the information under headings of directed, national, local and other (following the coding within the nominal chart). If the option is not chosen, all enhanced services are shown without subdivision.
Balance sheet
There are option flags in the statutory database, under the balance sheet node for the balance sheet and note display of debtors, bank, current liabilities and long term liabilities, which allow the layout of these items to be selected, as indicated below.
Debtors within current assets
There are the following choices:
Full note analysed by type and a single line on the balance sheet for total debtors.
No note with debtors analysed on the balance sheet by type and 3 separate codes listed individually.
No note with debtors shown on the balance sheet as a single total.
Note:The debtors range of codes, 7497-7499, are set up as items which will be separately disclosed. For the 1st choice above, they will be disclosed in the note; for the 2nd choice they will be shown on the balance sheet; for the 3rd choice they will not be shown but included in the total.
Bank
There are the following choices:
- Full note showing all codes and a single line on balance sheet PLUS lines for "separate" codes.
- No note with full analysis (ALL CODES) on balance sheet.
- No note with cash at bank shown as a single line on balance sheet PLUS lines for "separate" codes.
Note: The bank range of codes, 7890-7892, are set up as items which will be separately disclosed. These will ALWAYS be shown on the balance sheet and should only be posted to where this disclosure is required.
Current liabilities; Long term liabilities
These are set up in the same way, with options of:
- Full note analysed by type and a single line on balance sheet for total.
- No note with analysis on the balance sheet by type, including 3 separate codes for current liabilities only.
- No note with the total shown as a single line on the balance sheet.
Note: the creditors range of codes, 8147-8149, are set up as items which will be separately disclosed. For the 1st choice above, they will be disclosed in the note; for the 2nd choice they will be shown on the balance sheet; for the 3rd choice they will not be shown.
Drawings
There are two separate drawings notes:
- Detailed drawings for each partner, picking up each code that has a balance. This displays drawings down the page in groups of 5 partners at a time in columnar format, in portrait format.
- A summary of drawings for each partner, analysed in columns by drawings type (as posted to the codes below). Depending on the columns used, this switches between portrait and landscape.
| 9700-9711 9712 Type 2 9713 Type 3 9735-9749 9754-9768 9774-9783 9789-9798 9799-9800 Other |
Monthly drawings Type 2 (description entered in statutory database) Type 3 (description entered in statutory database) Private income Personal expenses Taxation payments Superannuation Additional Superannuation Other Other drawings |
Under the statutory database node there are options to suppress each note.
Note: the first monthly drawings code can be used either for posting month 1 or the full year. The nominal description for 9700 should be amended to reflect this.
Allocation of net income
Note M103 analyses net income by nominal postings made to prior allocation codes and entries made in the statutory database profit allocations grid. By default, this is not included in the accounts but can be triggered by a flag in the statutory database under Notes… Appropriations.
Management section
Management account formats within this pack provide:
- Detailed profit and loss account
- Five year summary
- Five year ratios
- Detailed capital accounts, current accounts and drawings in a printable and exportable format (see next section).
Detailed analysis of capital and current accounts and drawings
The main accounts pages provide summarised movements for capital accounts, current accounts and drawings. These analyse movements across 8 or 9 columns. For further detail, the management pages can be used. Within the management pages there are three formats which provide a detailed breakdown of all codes for all partners for the ranges of codes set up for capital accounts, current accounts and drawings. For capital and current accounts, the options in the statutory database are similar:

The user has the option to include the format within the management accounts printed output, or to leave it as a standalone format to be printed or exported separately. There is a further option to choose which of the active capital accounts to include.
Capital and current accounts will normally fit onto one page width but if not, they will wrap onto the next page. For drawings there are options relating to the format of the output:

Again, the user has the option to include the format within the management accounts printed output, or to leave it as a standalone format to be printed or exported separately. The user can choose the font size, which changes the number of columns that will show on one page. Excess columns will wrap to a new page. The export option provides up to 75 columns (over 70 drawings types) which can be exported to a spreadsheet.
Lead schedules
The formats do not currently include any lead schedules.
Known issues and further training
There are no known issues.
CCH can provide a training course to focus on the generation of Medical accounts. If you would like to find out more, please contact your Account Manager.
Appendix 1- Nominal structure
Income and Expenditure account
Structure and related nominal codes
| Face of the I & E account | Codes | In Notes | |
| Fees and allowances | From | To | |
| GMS 2 Income PMS income PCO admin income Spare fees and allowances group 1 Spare fees and allowances group 2 Spare fees and allowances group 3 Spare fees and allowances group 4 Spare fees and allowances group 5 Spare fees and allowances group 6 Spare fees and allowances group 7 Spare fees and allowances group 8 Spare fees and allowances group 9 Enhanced services Spare fees and allowances group 10 Quality and outcomes Spare fees and allowances group 11 Premises income Information and management technology Dispensing personal administration Spare fees and allowances group 12 |
0001 0011 0020 0021 0022 0023 0024 0025 0026 0027 0028 0029 0030 0034 0035 0036 0037 0038 0039 0040 |
0010 0019 0033 |
10 groups 9 groups Direct, National, Local, or as a list |
| NHS income | From | To | |
| Drugs income Outside appointments Spare NHS income group 1 Spare NHS income group 2 Spare NHS income group 3 Spare NHS income group 4 Community contracts Reimbursement of expenses Other NHS income group 1 Other NHS income group 2 Other NHS income group 3 Other NHS income group 4 Other NHS income group 5 Employer's superannuation |
0101 0102 0107 0108 0109 0110 0111 0140 0240 0241 0242 0243 0244 0245 |
0106 0120 |
5 groups 10 groups 0249 |
| Non NHS income | From | To | |
| Private medical Reimbursement of expenses Outside appointments Spare income group 1 Spare income group 2 Spare income group 3 Spare income group 4 Spare income group 5 Spare income group 6 Spare income group 7 Spare income group 8 Spare income group 9 Spare income group 10 Other income |
0300 0301 0400 0410 0411 0412 0413 0414 0415 0416 0417 0418 0419 0420 |
0399 0404 |
5 groups |
| Practice expenses | From | To | |
| Drugs costs Medical expenses Spare medical expense group 2 Spare medical expense group 3 Staff costs Premises Administration 1 Administration 2 Administration 3 Administration 4 Finance Spare practice expense Spare practice expense 2 Spare practice expense 3 Spare practice expense 4 Depreciation |
0500 1210 1230 1250 3000 3300 3100 3400 3960 3990 4500 3986 3987 3988 3989 3900 |
0999 1229 1249 1999 3099 3399 3299 3899 3985 3999 4599 3959 |
Appendix 2- Formula
APLinkOfficer
This command produces a multi column grid of Officers and their associated nominals, and is of the general form: =APLinkOfficer("CUR01","Active","List","a","OfficerName","ColumnDataRegulateOn","Ro wDataRegulateOn","TotalsLineOn","officersubcode","NominalTotal","OfficerTotal",14)
This formula has two sections:
Section 1 – Defines what data is being collated - "CUR01","Active","List","a","OfficerName","ColumnDataRegulateOn","RowDataRegulate On"
Section 2 – Defines what data is displayed - "TotalsLineOn","officersubcode","NominalTotal","OfficerTotal",14
Section 1 components
"CUR01" - This is the name of the Officer Range that you want to report on Status – This is the type of officer to be reported on
- options are Active, Former, All
- Default = “Active”
This option only needs to be included if you want to report on Officers other than Active
Period – This defines the period that you want to report on
- Options are “a” or “b”, current or comparative
- Default = “a”
This option only needs to be included if you want to report on Officers other than “a”
List - This defines how the officers are sorted
- Options
- List – Officers listed as appears on the Officers screen
- Alphabetical – Officer listed Alphabetically (Currently disabled)
- Subcode – Officers listed in sub code order
- Default = “List”
This option only needs to be included if you want to sort officers other than by “List”
ColumnDataRegulate – This will regulate the display of all reported columns
- Options are On or Off
- Default = ”ColumnDataRegulateOn”
This option only needs to be included if you want to see all unregulated columns
RowDataRegulate - This will regulate the display of all reported columns
- Options are On or Off
- Default = ”RowDataRegulateOn”
This option only needs to be included if you want to see all unregulated rows
Section 2 components
"TotalsLineOn" - This controls column totals
- Options are On or Off
- Default = "TotalsLineOn"
This option only needs to be included if you want hide column totals
"OfficerName" – Displays the Officer name – This is optional
"officersubcode" – Displays the associated sub code - This is optional
"OfficerTotal" – Displays the Cross cast total for each officer - This is optional
"NominalTotal" – Displays the Nominal balances for each Officer - This is Mandatory
Maxcolumns – defines the total number of columns in the whole grid up to an including the right hand margin -
As several of the components have defaults, the formula can usually be shortened if the defaults are being accepted. For example: =APLinkOfficer("CUR01","Active","List","A","OfficerName","ColumnDataRegulateOn","Ro wDataRegulateOn","TotalsLineOn","officersubcode","NominalTotal","OfficerTotal")
Can be shortened to:
=APLinkOfficer("CUR1","OfficerName","officersubcode","NominalTotal","OfficerTotal") as both will achieve the same results.
Formatting
This is the output achieved where the format below is correctly formatted:


To use the formula, the format must be formatted as follows, starting in the same cell as the command, ie in C7 above.

APProfitshare
This allows the user to report for the whole period or any part of the period either the Ratio, Percentage or Profit share amount for an individual officer linked to a specific nominal code. =APProfitShare(SubCode, periodNumber, year, "Ratio, Percent, ProfitShare") approfitshare("001",1,"a","ProfitShare")
If period =0 then total for the accounting period is returned “Ratio, Percent, ProfitShare” – Defines which data you want to appear
- Ratio
- Percent
- Profitshare
APProfitPeriod
This returns information regarding each profit period
APProfitperiod(Periodnumber,"a,b","Start,End,Length")